Odoo 14 Marketing Automation Module

Odoo 14 Marketing Automation Module

Odoo Marketing Automation Module is the best marketing automation software for automating your company's marketing campaigns and sales activities.

The cost-effective module will assist you in handling all of your complex marketing responsibilities with ease. The module also has a well-organized reporting area that allows us to view and analyze the many reports generated by each activity.

Link Tracker, Tracer, and Participants are the three menus available in the Odoo Marketing module's reporting area. Each of these menus will be discussed in depth in this blog. Let's have a look at the menu screenshot first. 

Let's take a closer look at each of these menus.
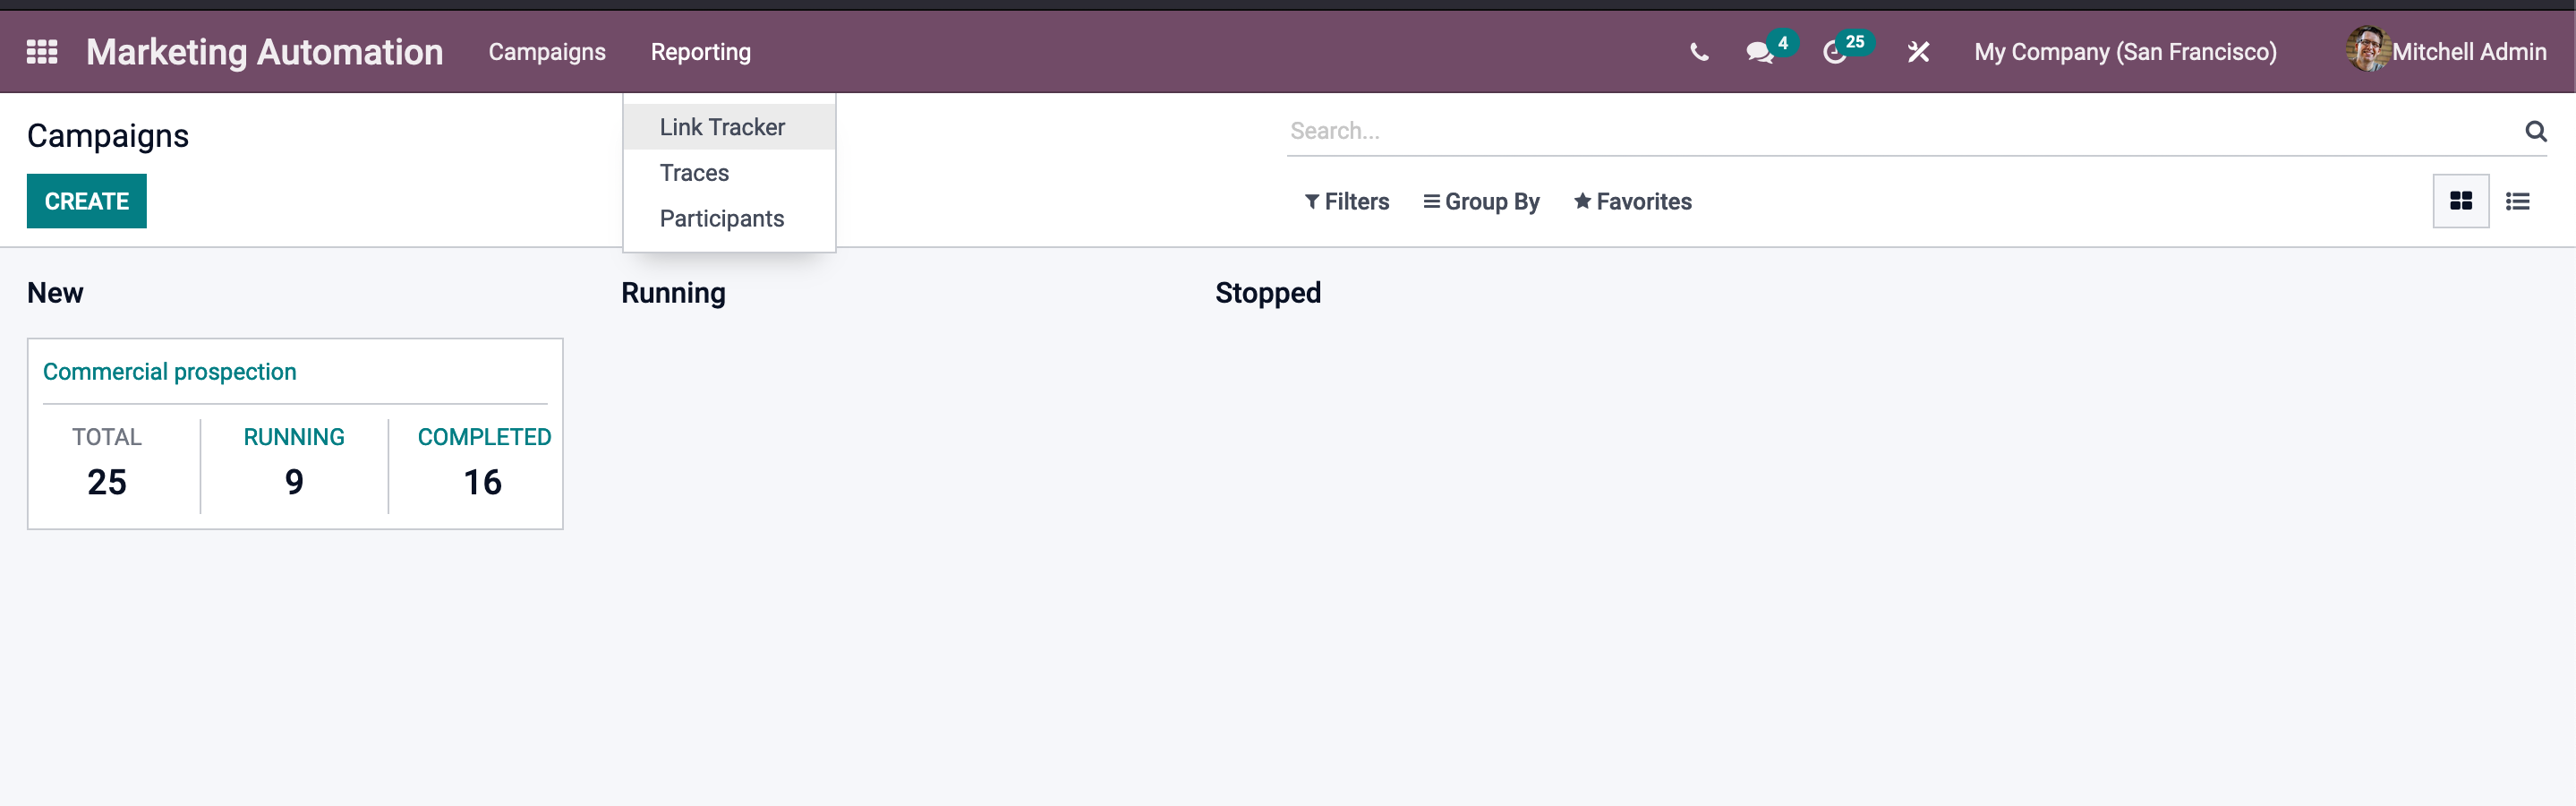
First and foremost, we can talk about the available Participants' timeframe. 
 
Participants

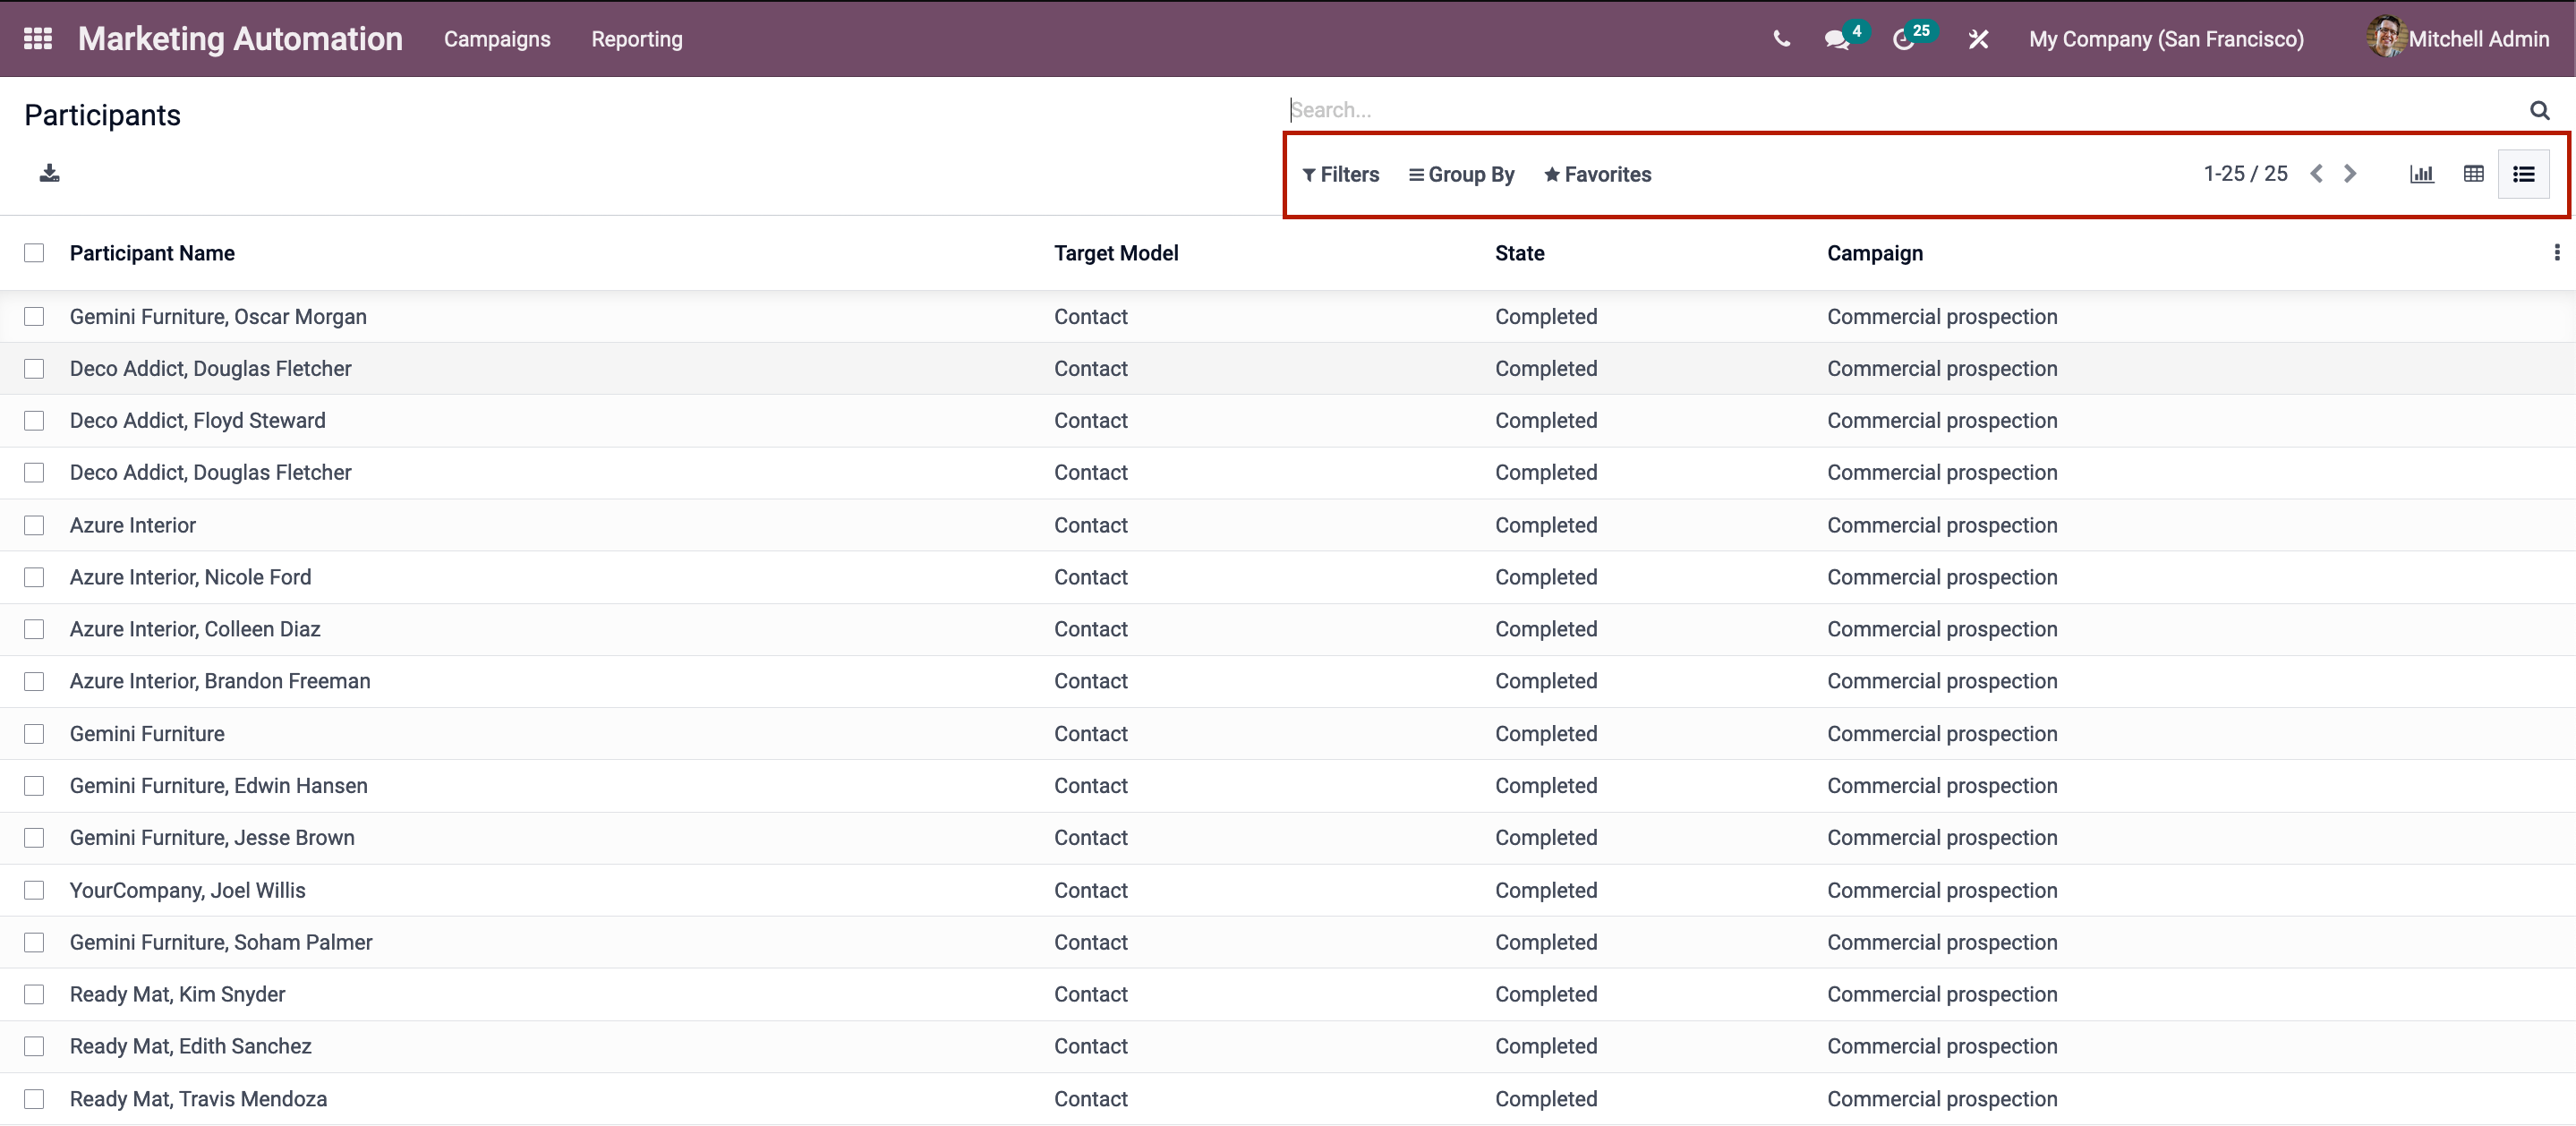
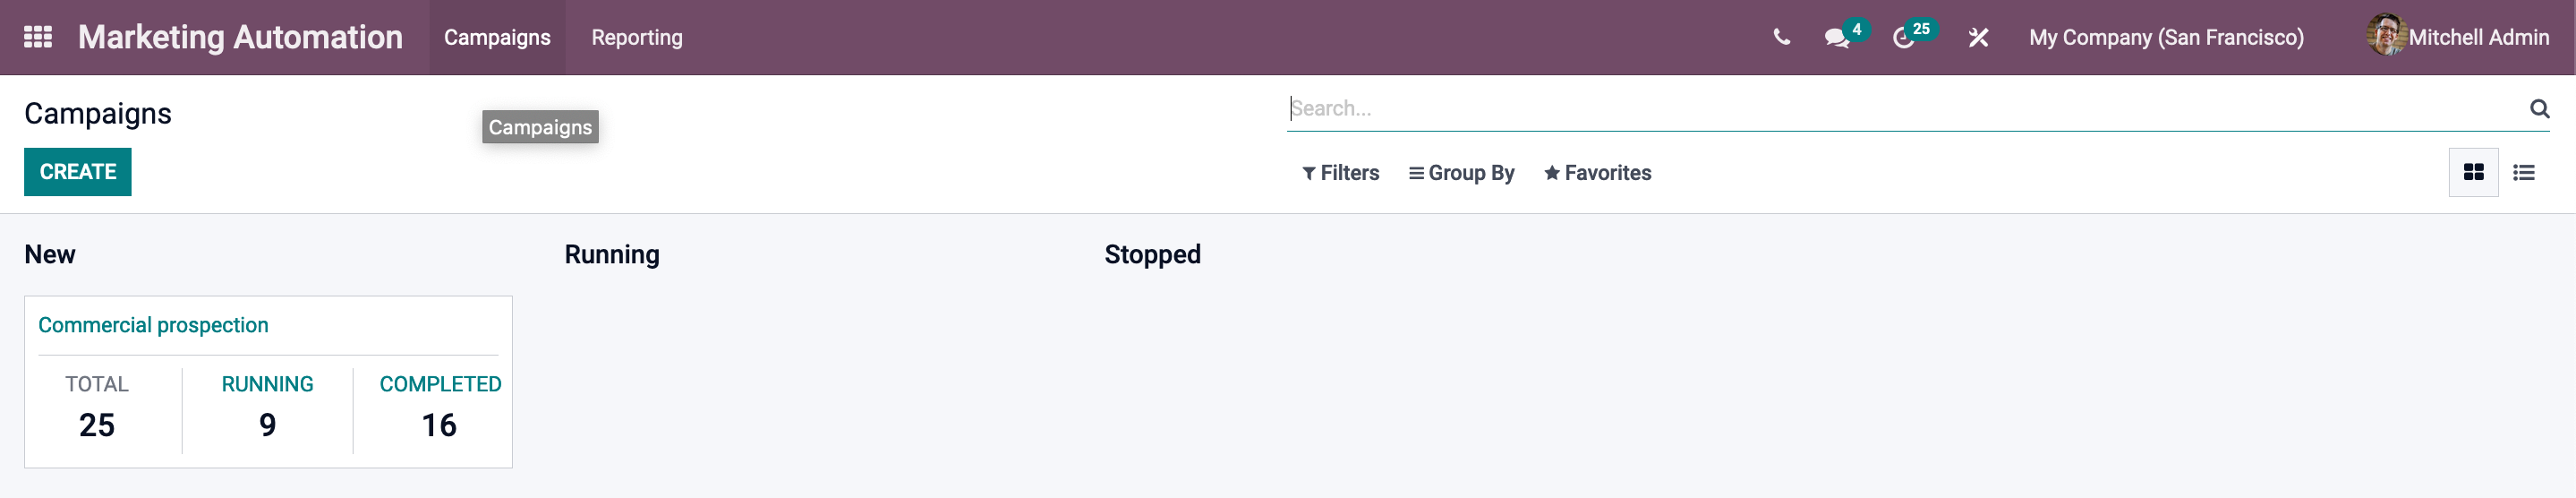
The Participants pane in Odoo Marketing Automation Module will assist you in keeping track of all of the Participants' information. 


The window can be viewed in a number of different ways, including graph, pivot, and list views. The data is represented in a List view as seen below. 

You can see the Participants Name, as well as the Target Model, State, and Campaign name, in the window. The workflow can be viewed by clicking on each of the records. Let's look at the information for the record Deco Addict, Douglas Fletcher. 
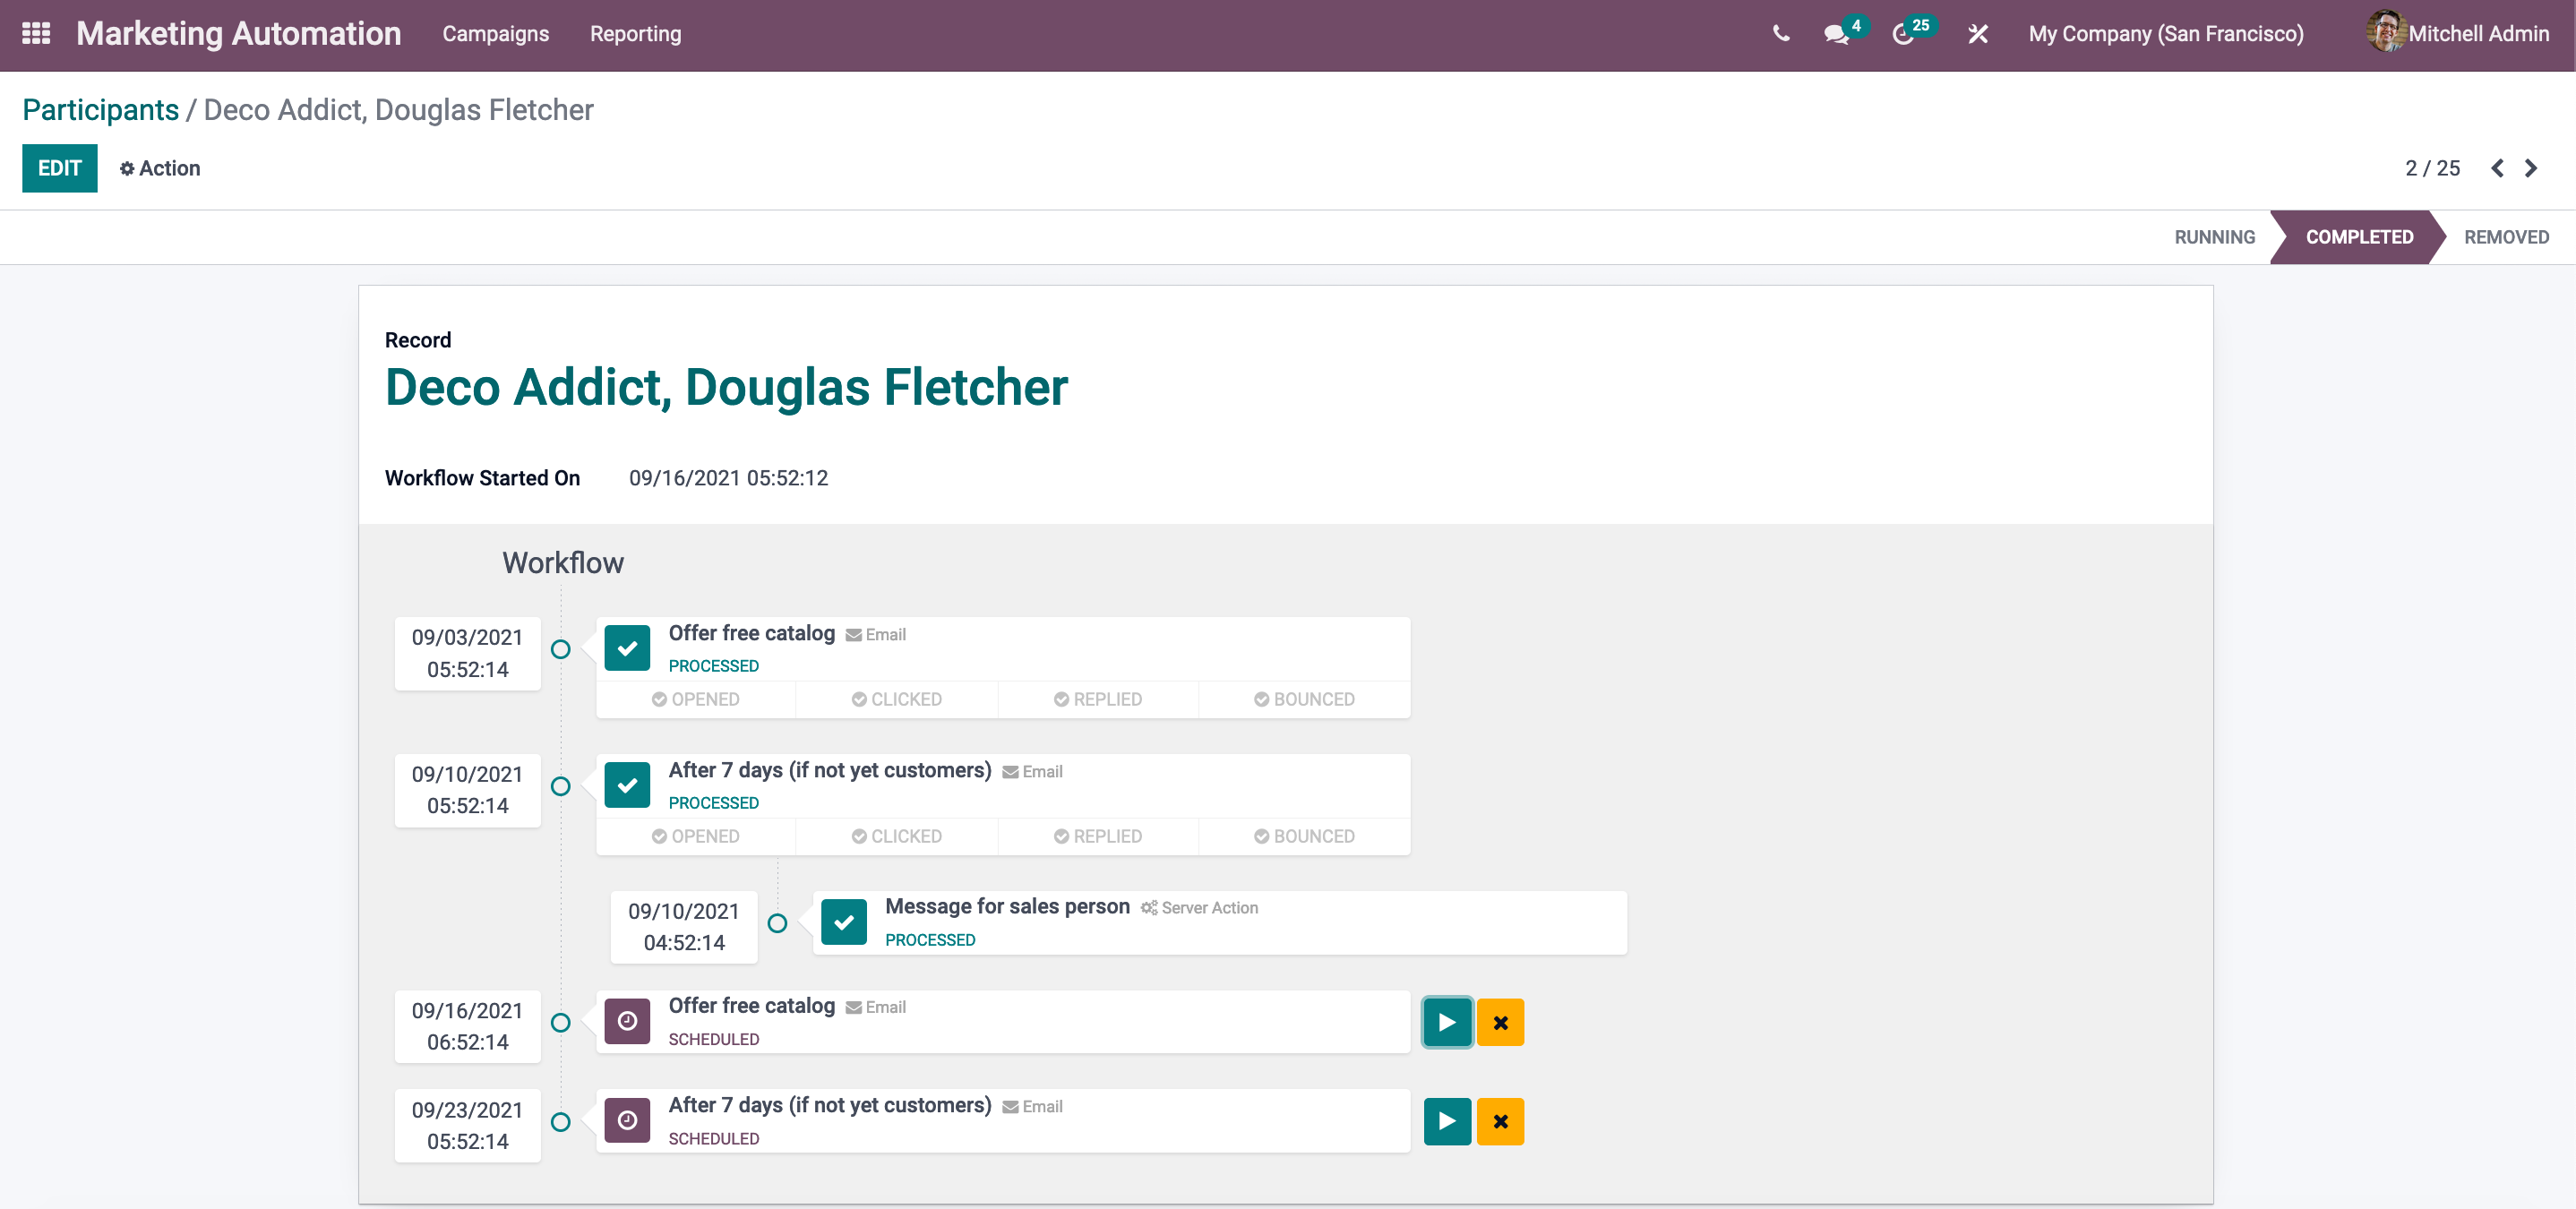
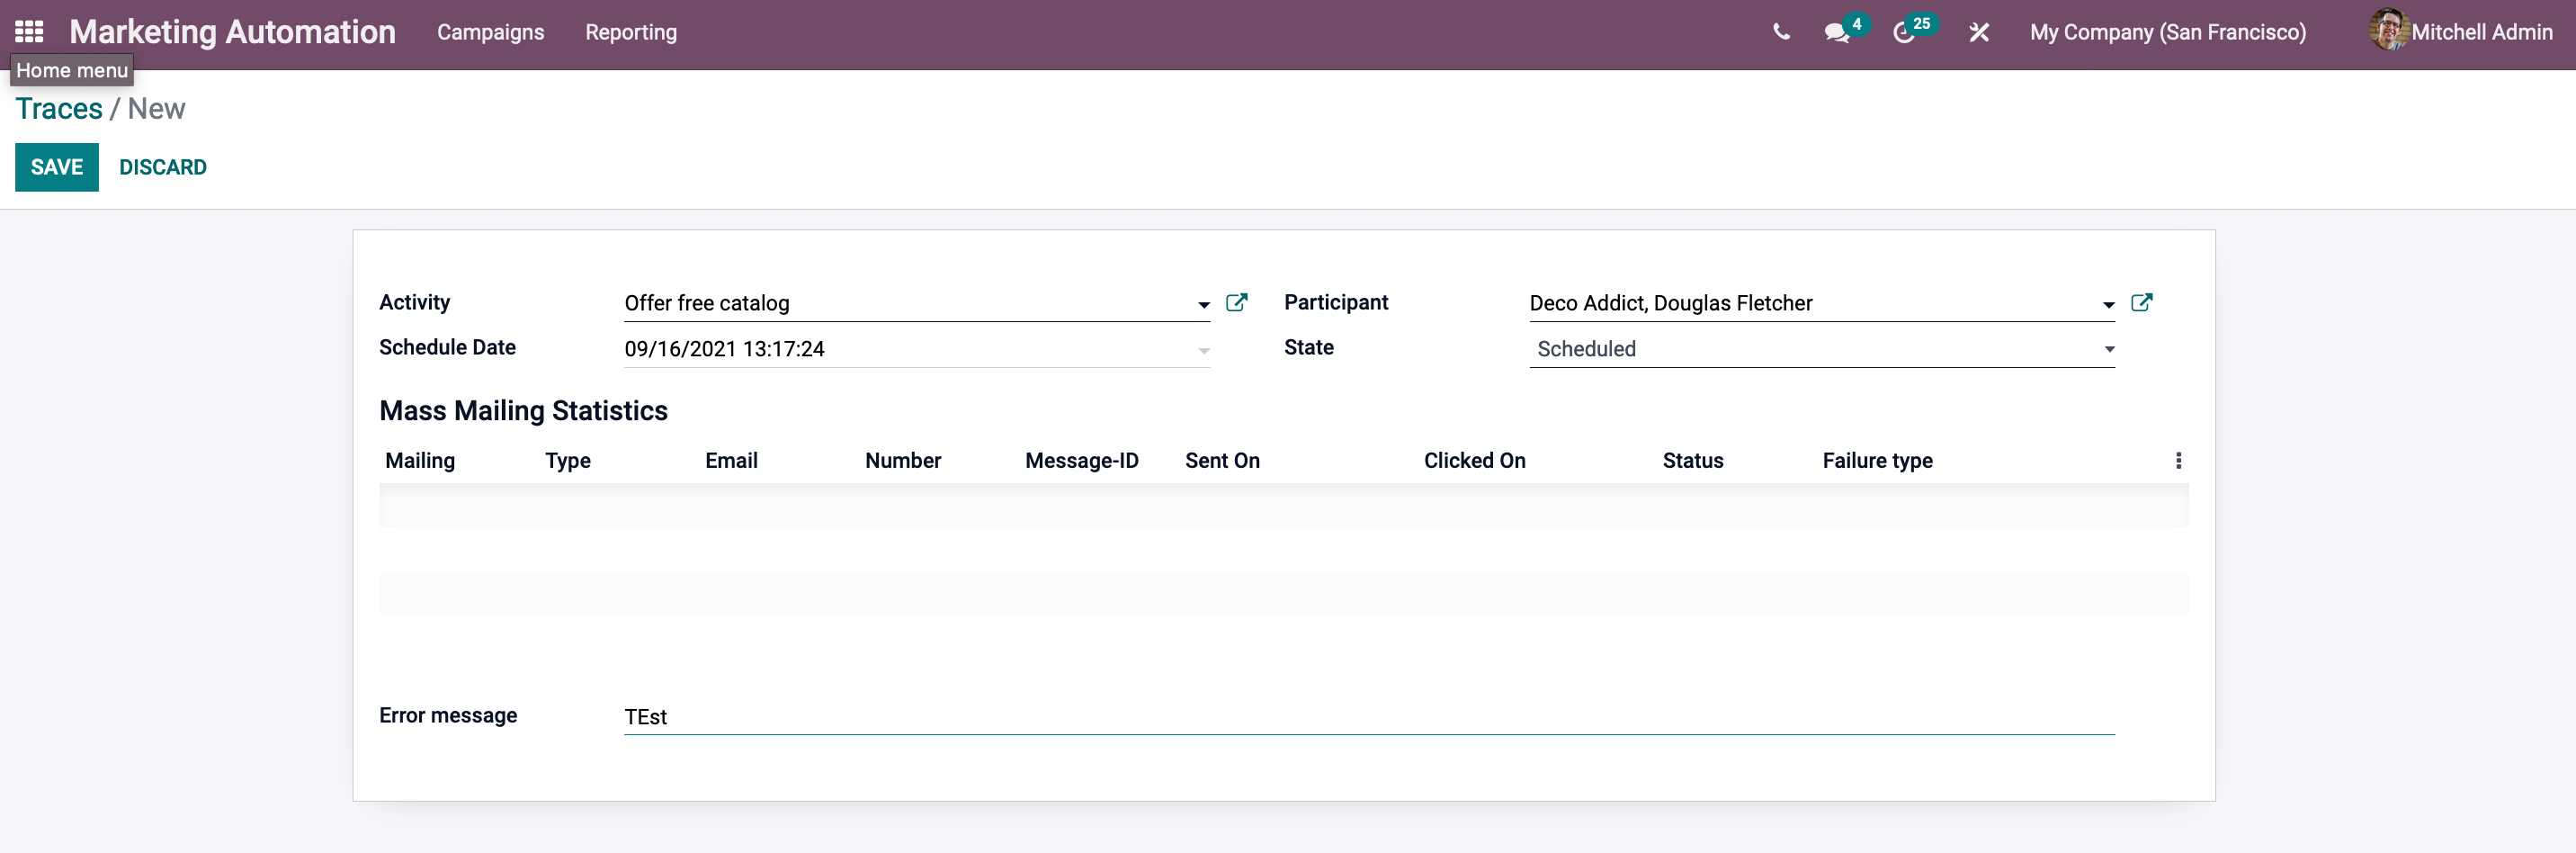
You can see the record's status in the right upper corner of the window. The record's status is Removed in this case. The term "removed" refers to a record that no longer exists. Then you can see the record name as well as the date and time when the workflow started. The workflow can then be viewed. The EDIT menu may be found in the window's top left corner, and it allows you to make changes to the data if necessary.
 
Returning to the Participants window, Odoo provides you with a variety of customized and default parameters. These options can be found on the upper right side of the window, as shown in the screenshot. You can use the Search tool to find the record you're looking for. The Filters option, which can be found under the Search option, allows you to sort the data in several ways. When you choose an option, a dropdown menu will appear, as seen in the image above. 
 

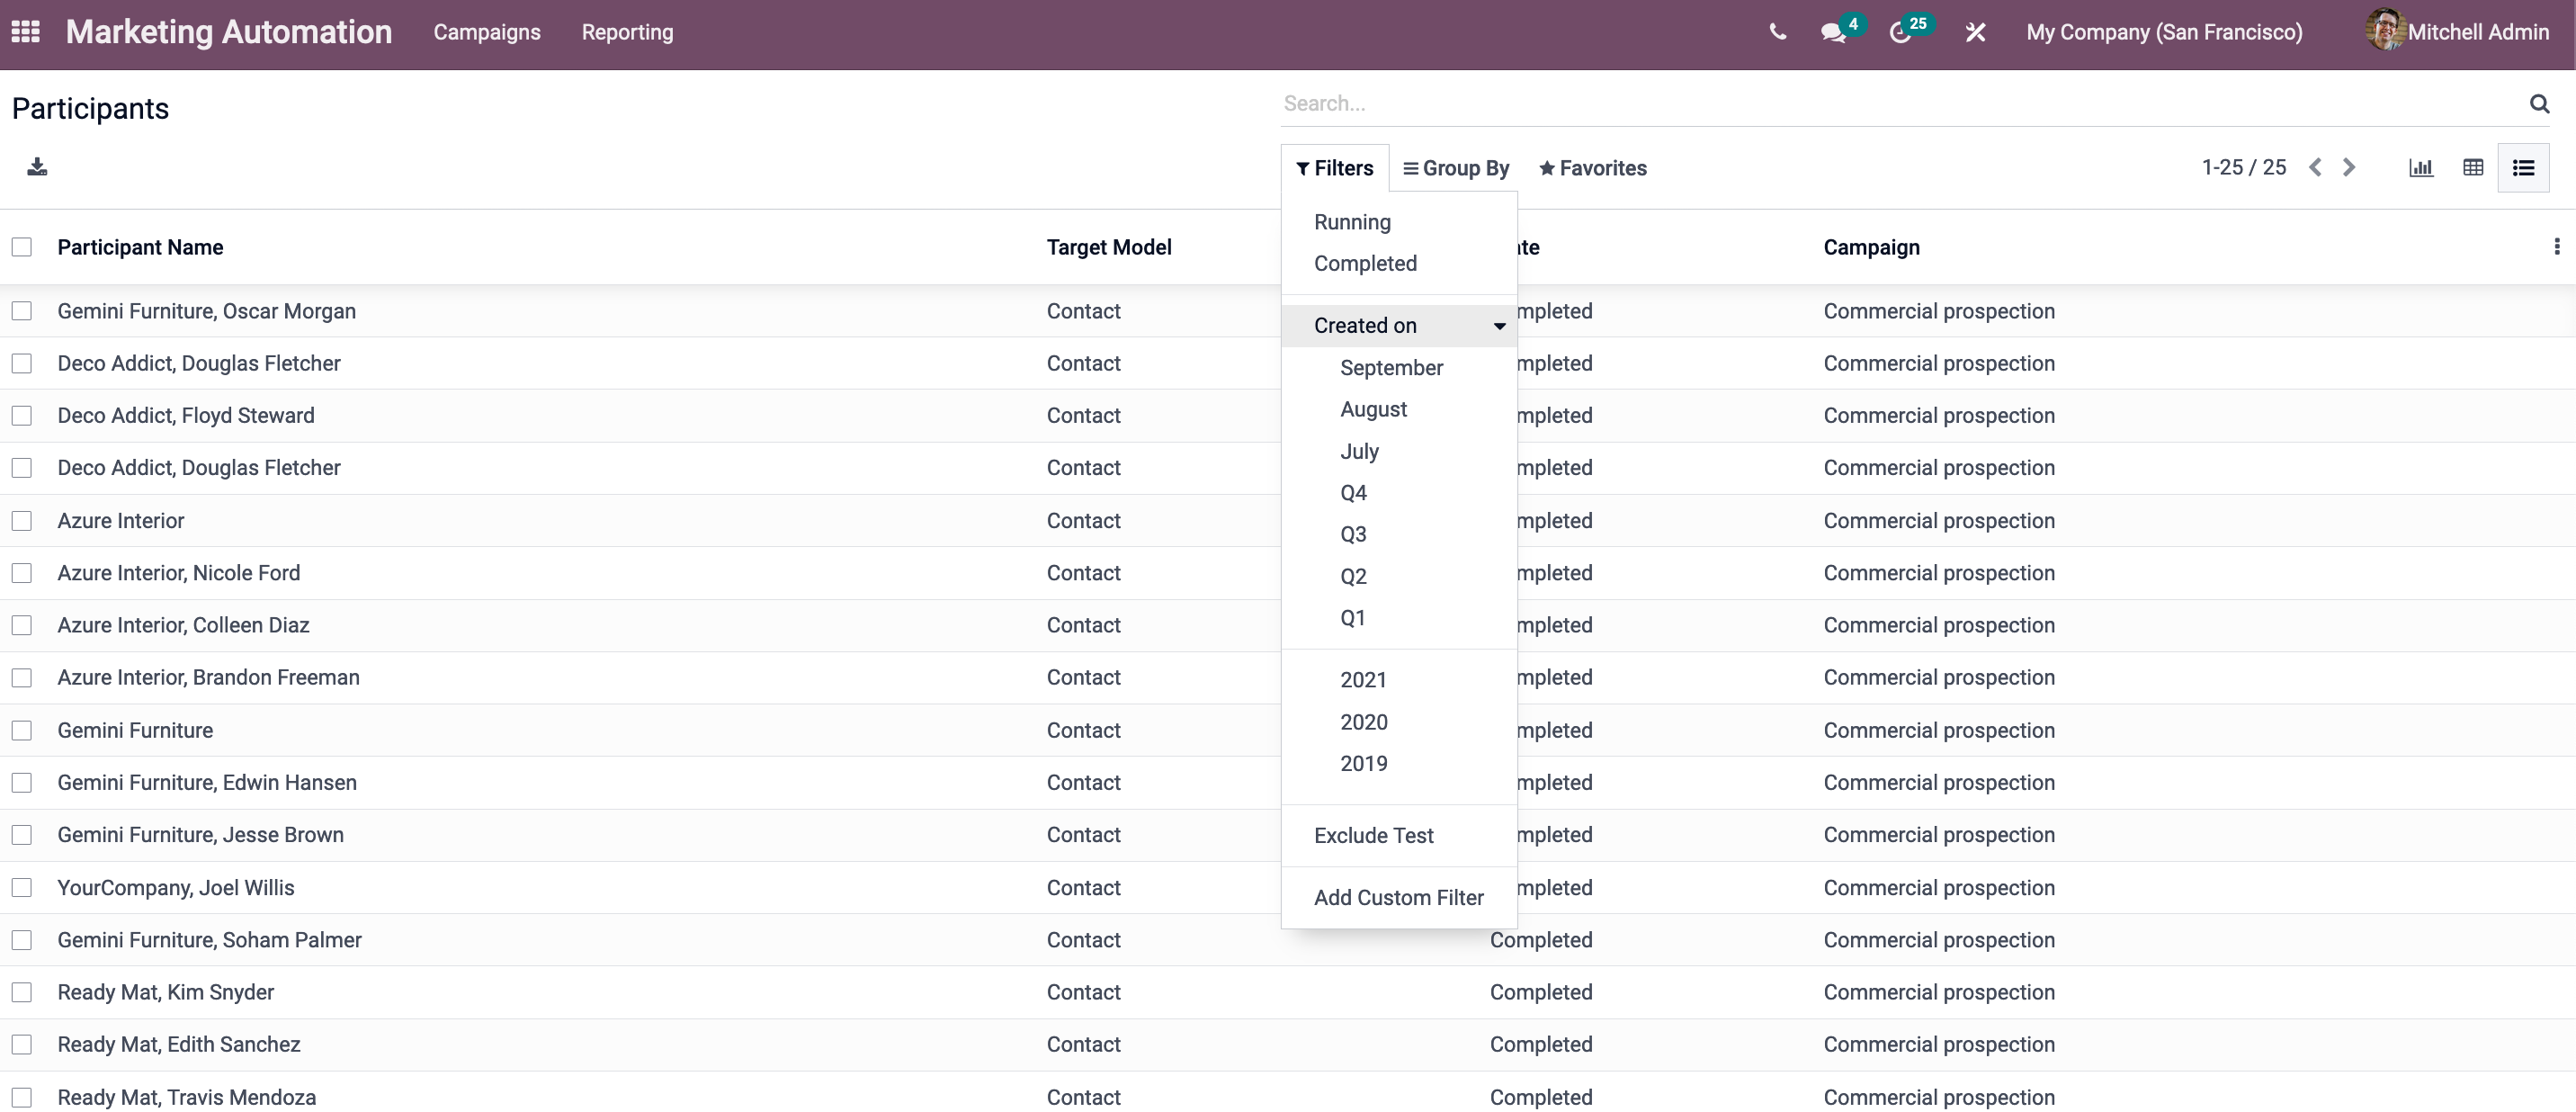
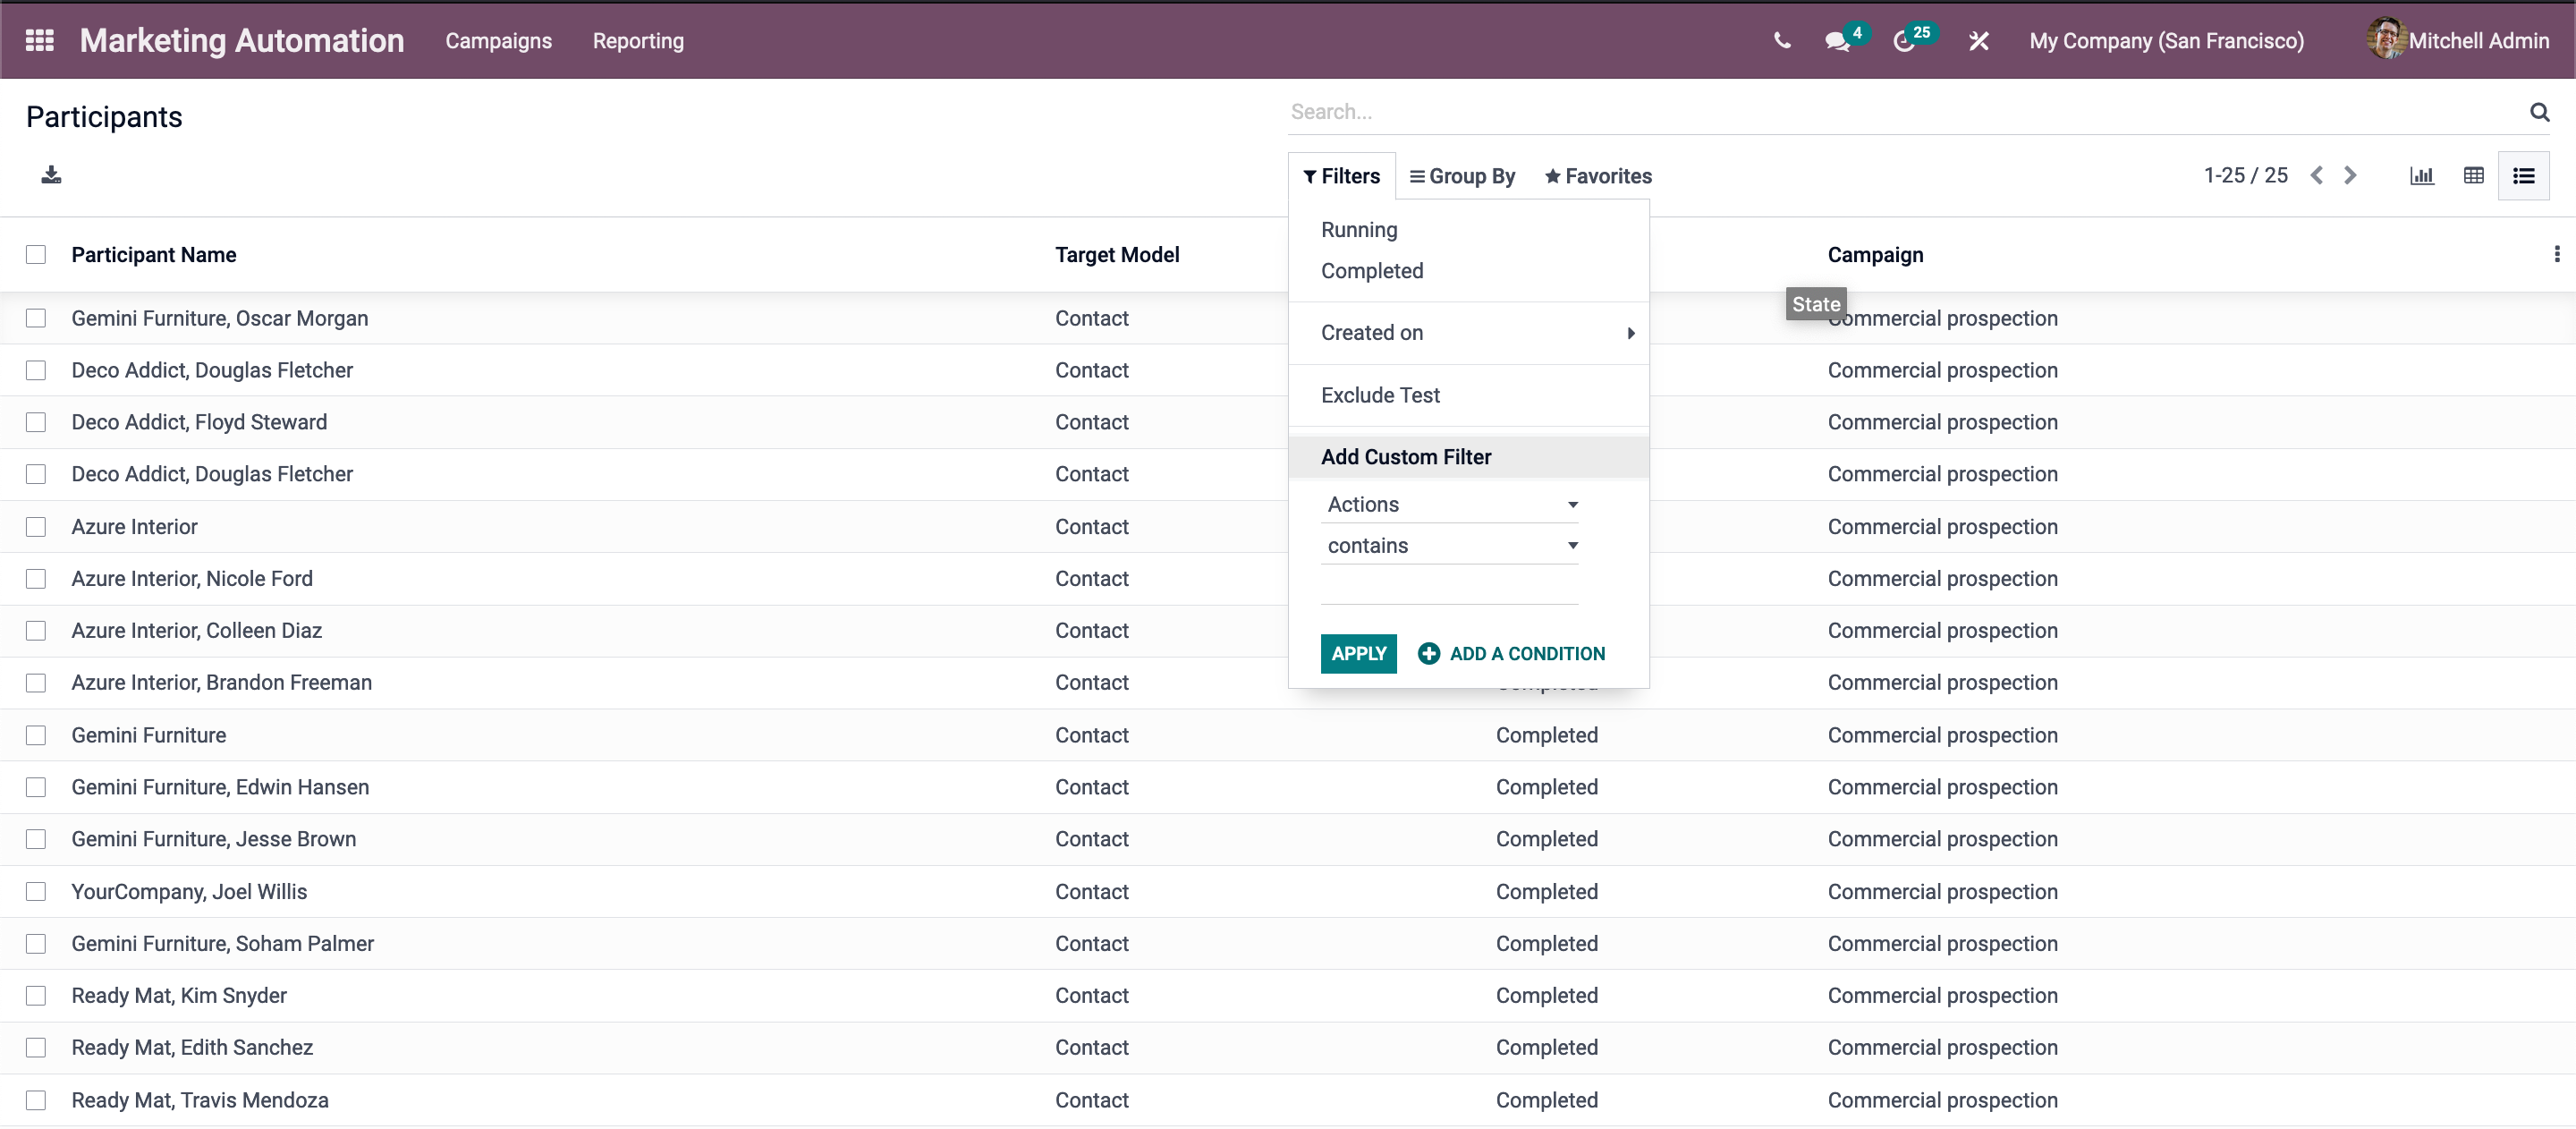
The following options are available in this pop-up window.

-Running

-Completed

-Created On:

-Excluded Test

-Add Customer Filter

You can view the participant's record in the Running status if you choose the Running option. Similarly, you may sort the data to the entries with Completed the campaign by selecting the Completed option. By selecting the Created on option, you can also view the participant's window month by month and year by year.

 
Additionally, you can use the Add Custom Filter option to create your own custom filters. This option is available to you based on your needs. You may also add a condition to the custom filter option.
 
The Group By option, on the other hand, allows you to categorize the provided data into several groups. When the platform has a lot of data, this option comes in handy. 
 
The default and customized options for shortlisting the data are also available here. The Favourite option in the window is the default option that will aid you in data searching. This feature allows you to save your current searches. As a result, it will be quite useful for future reference. 
 
The Participants window's Pivotview will appear as seen in the image. 
 
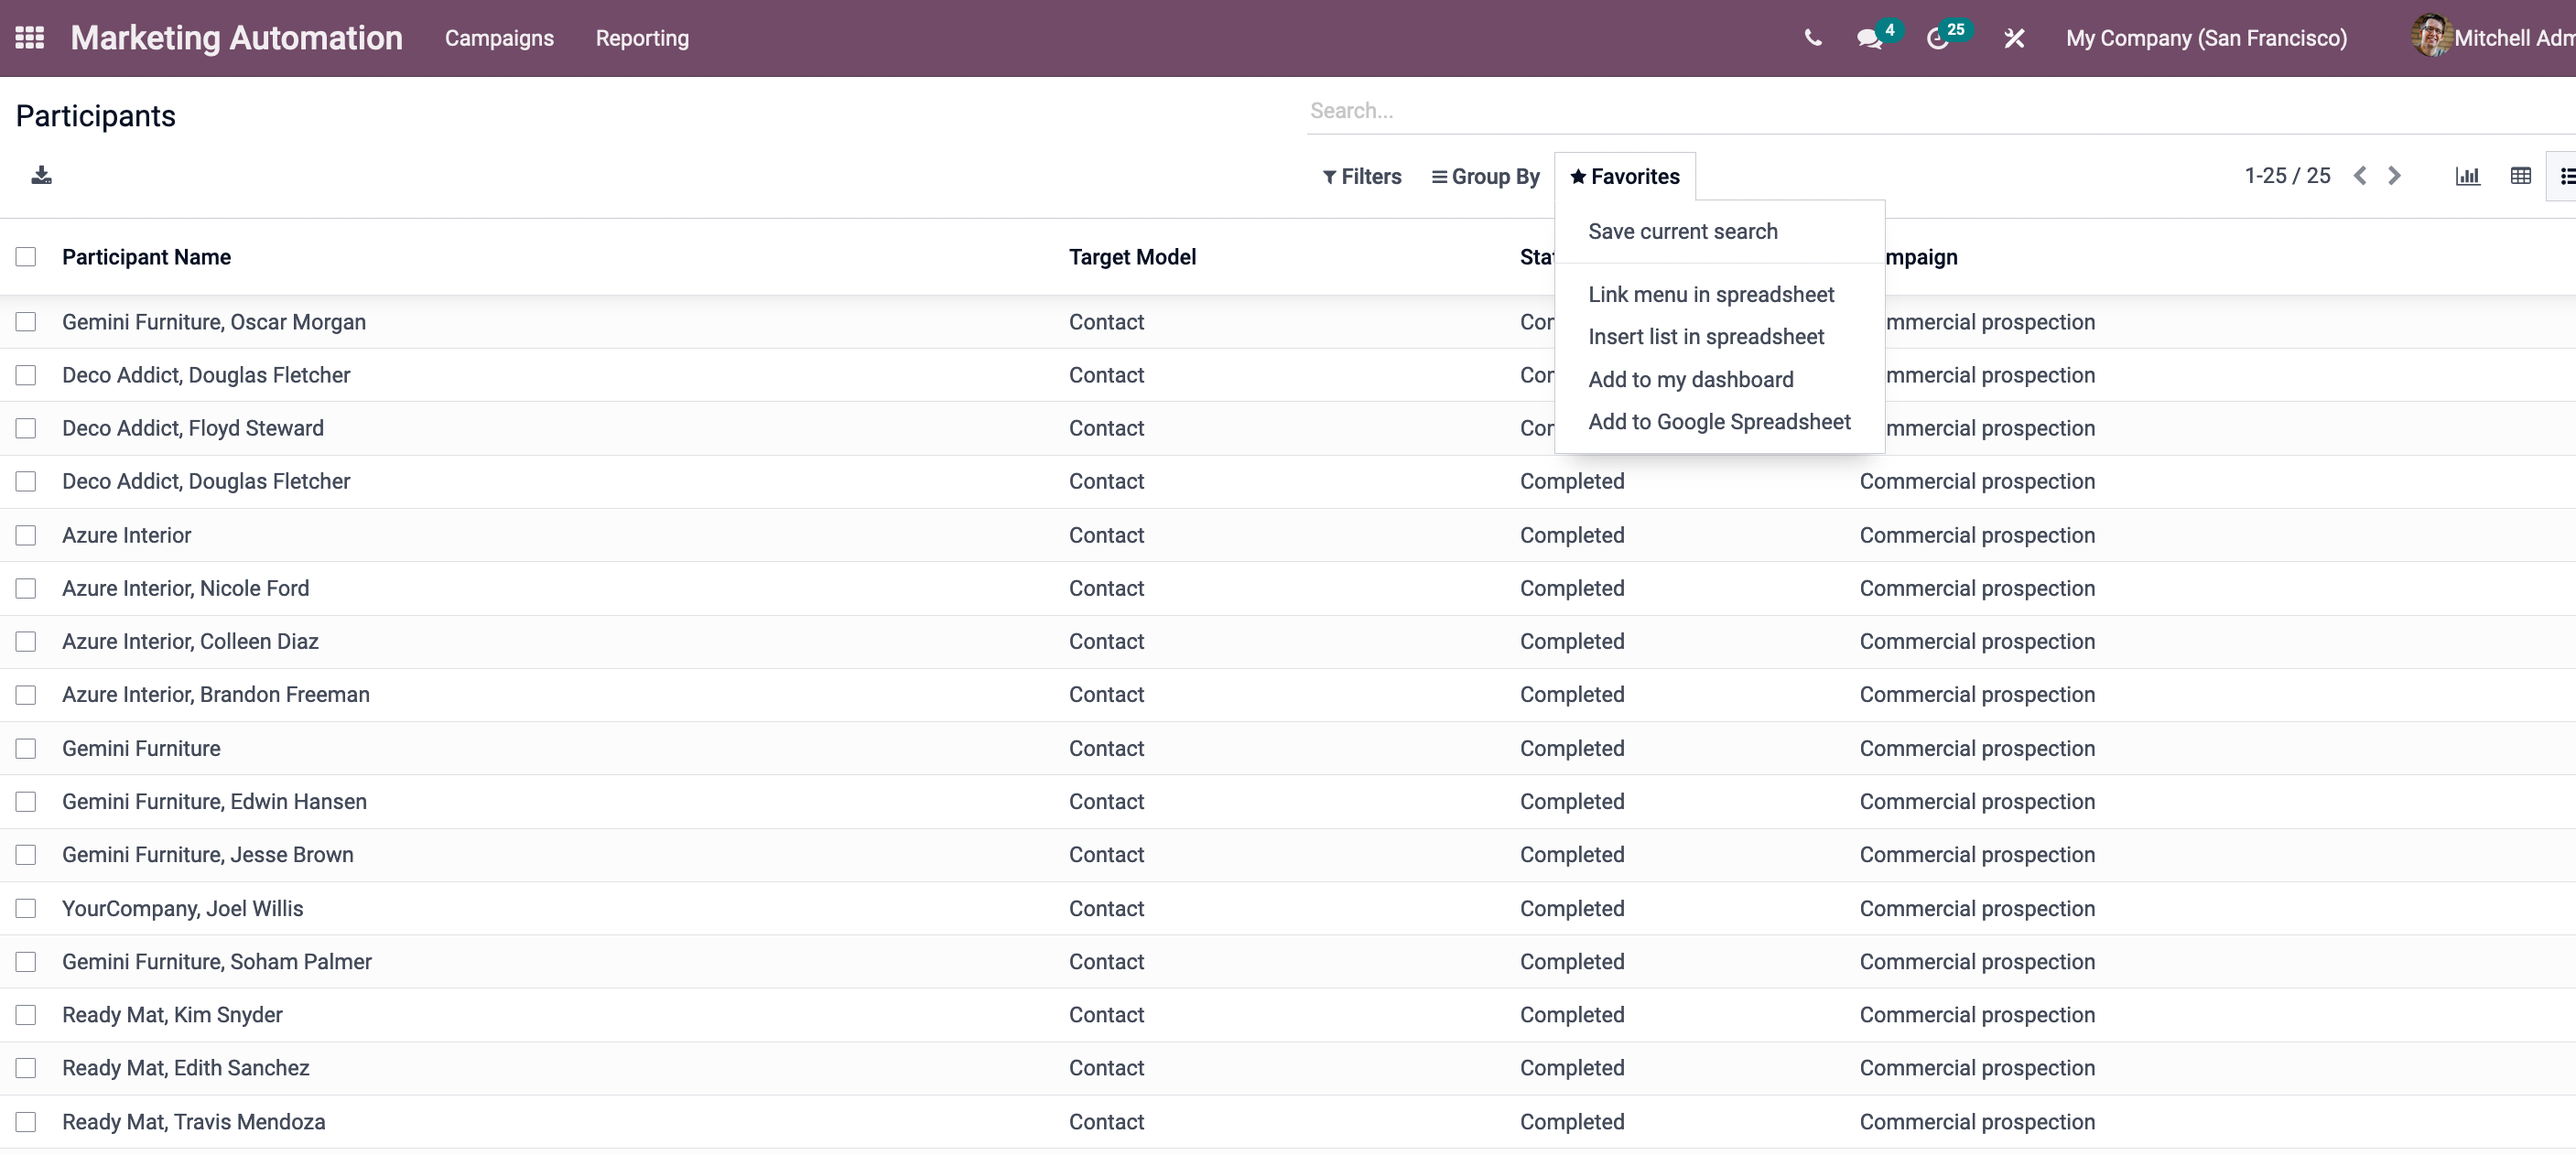
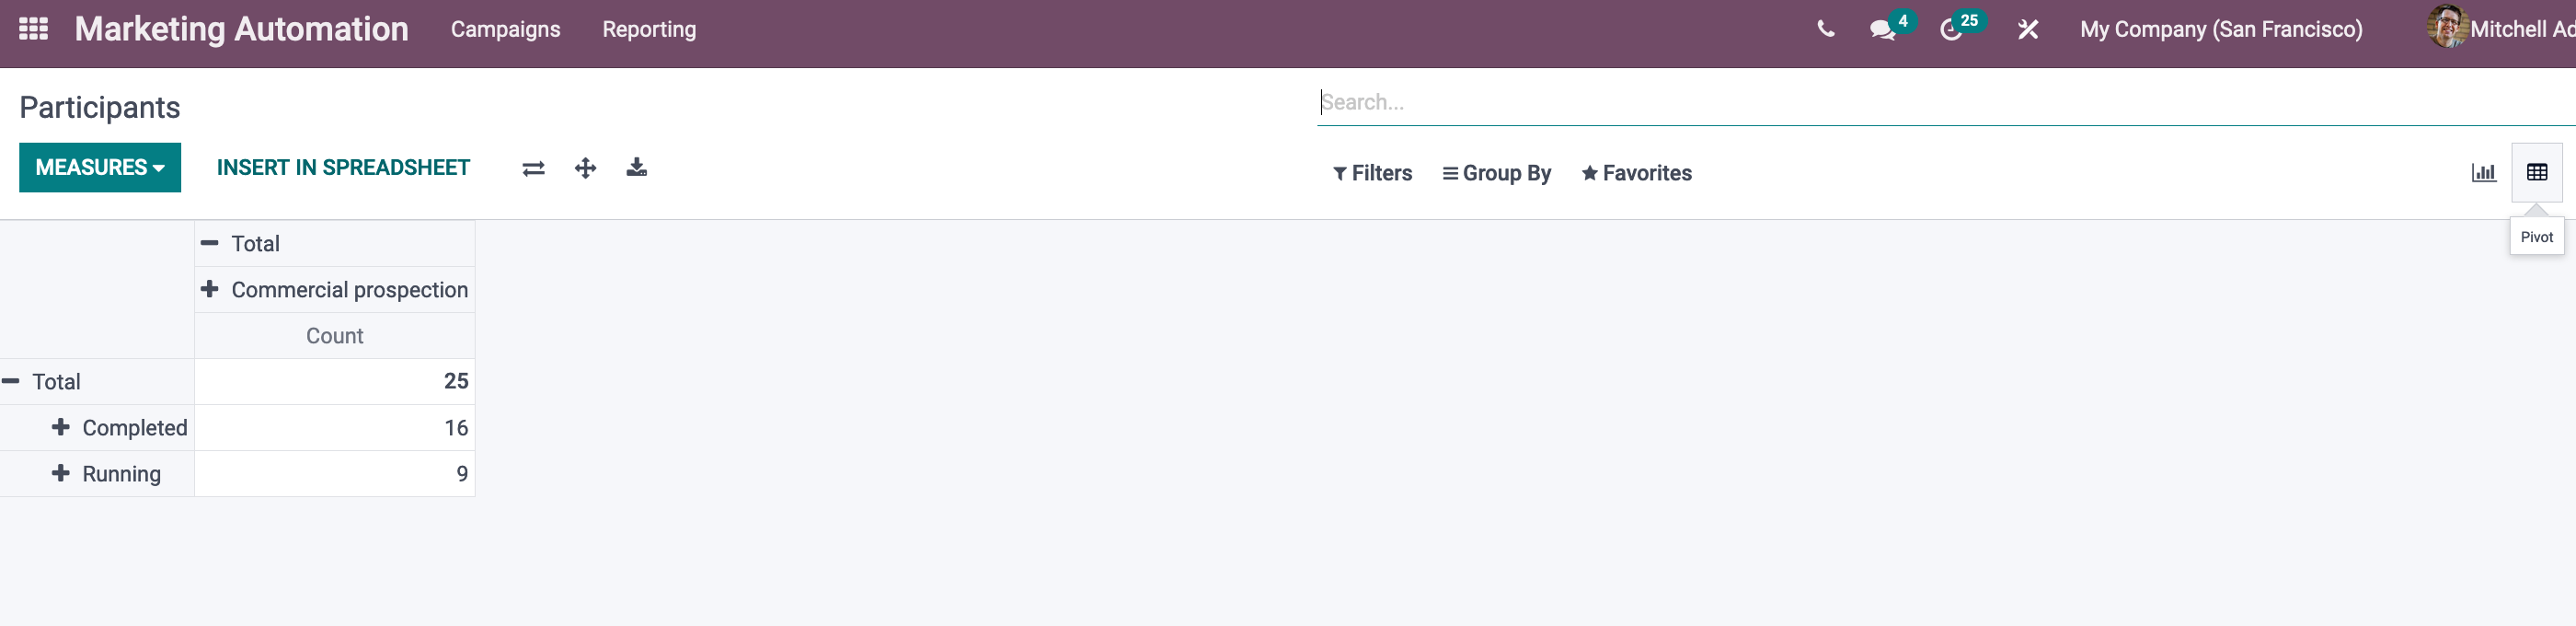
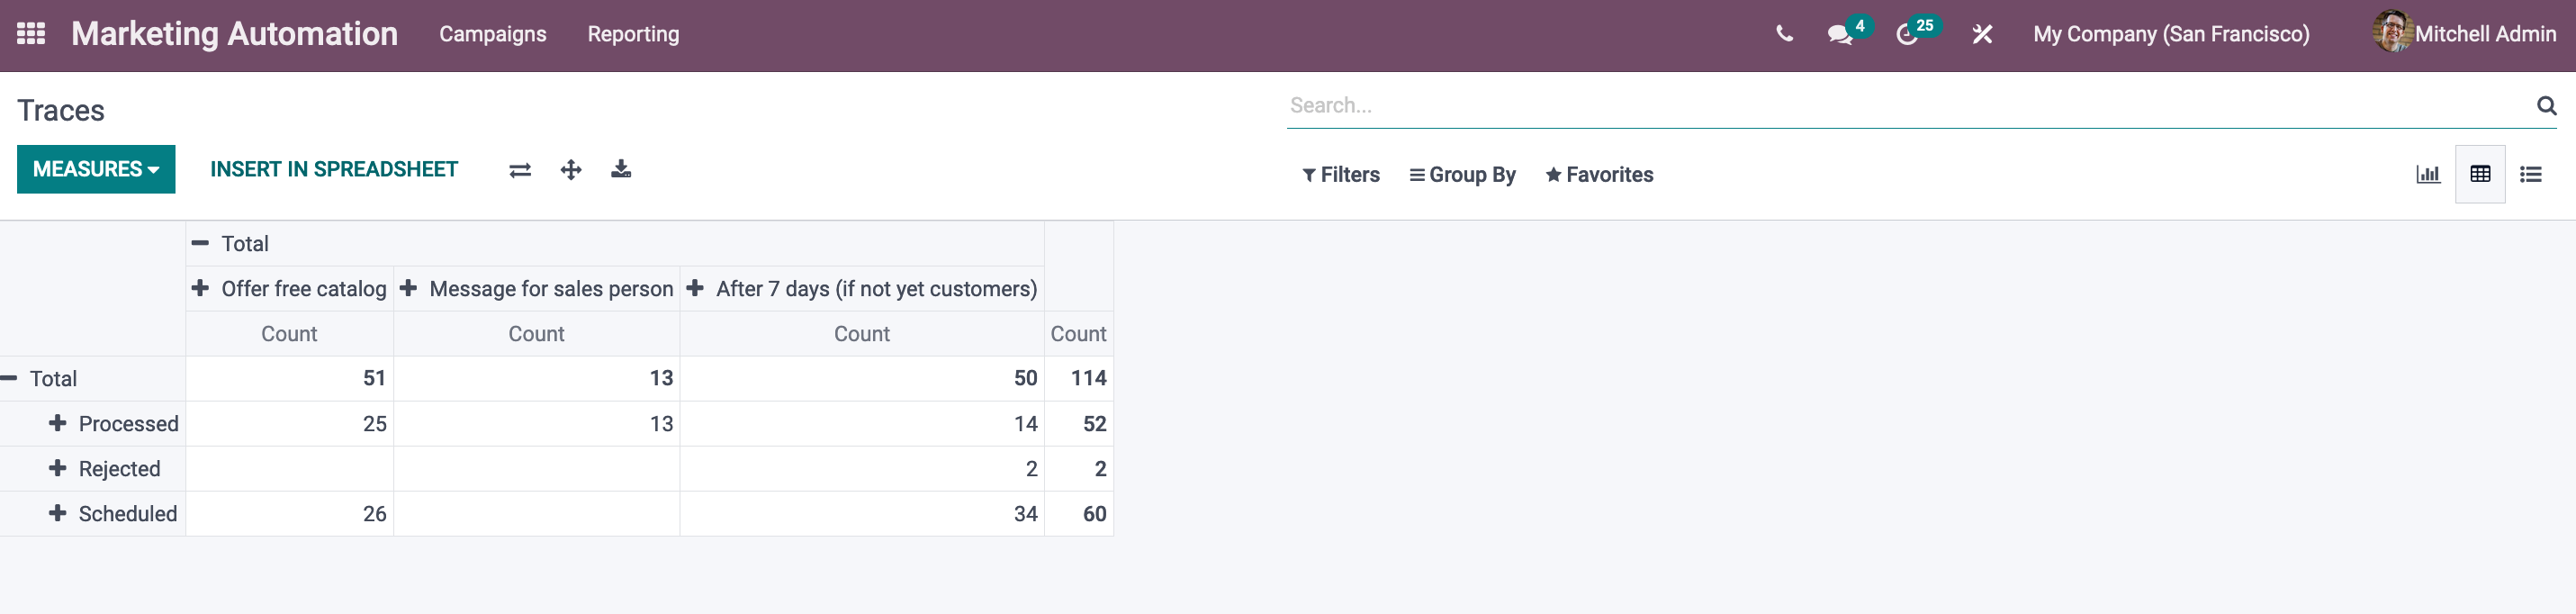
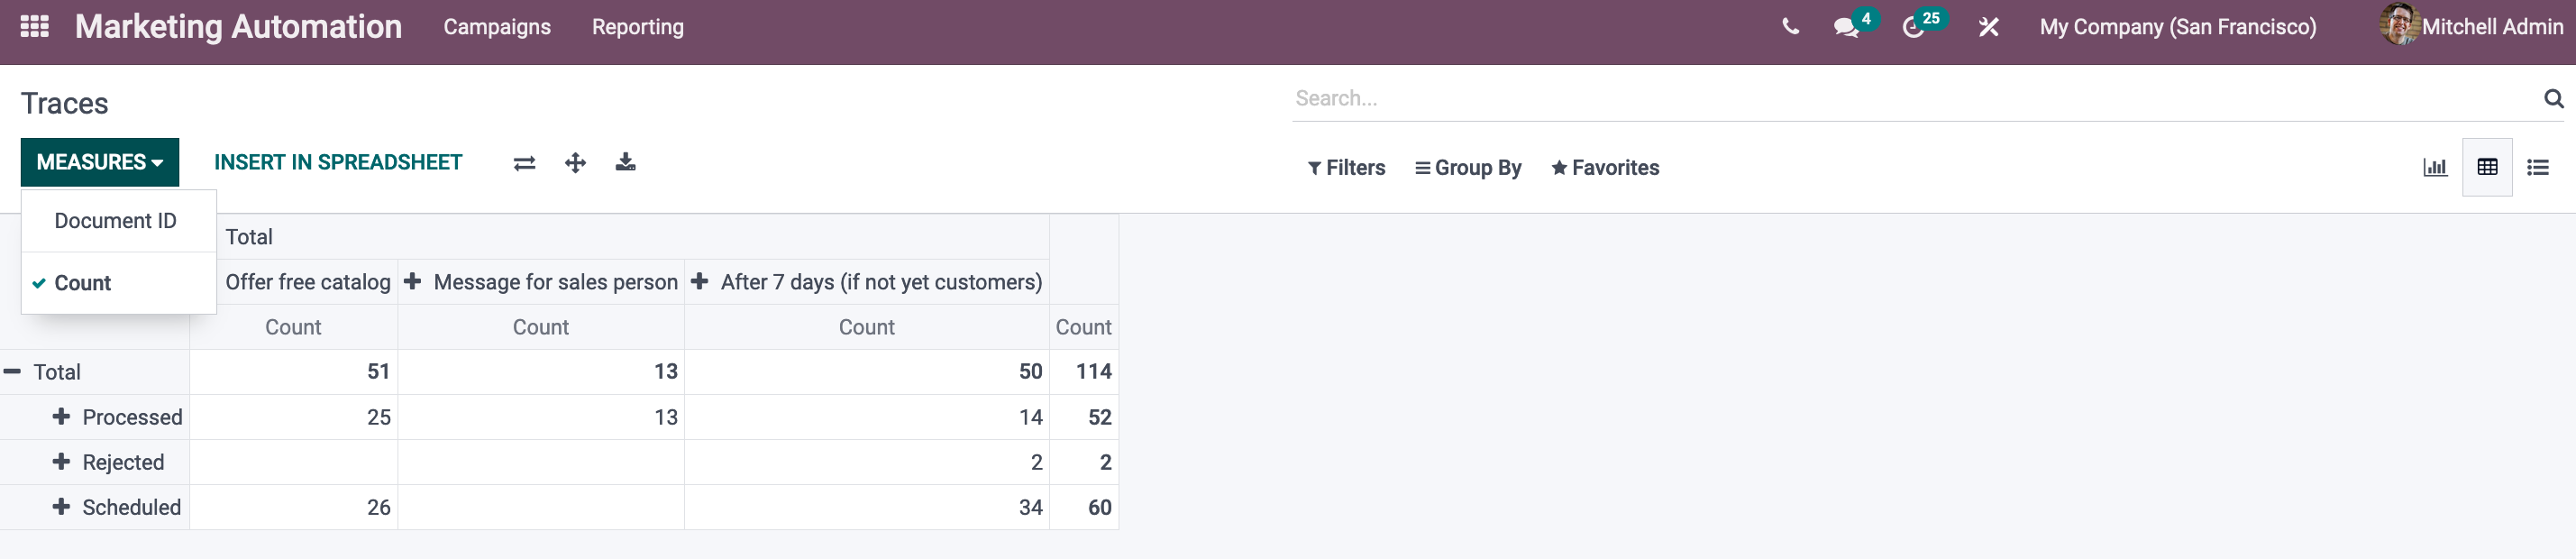
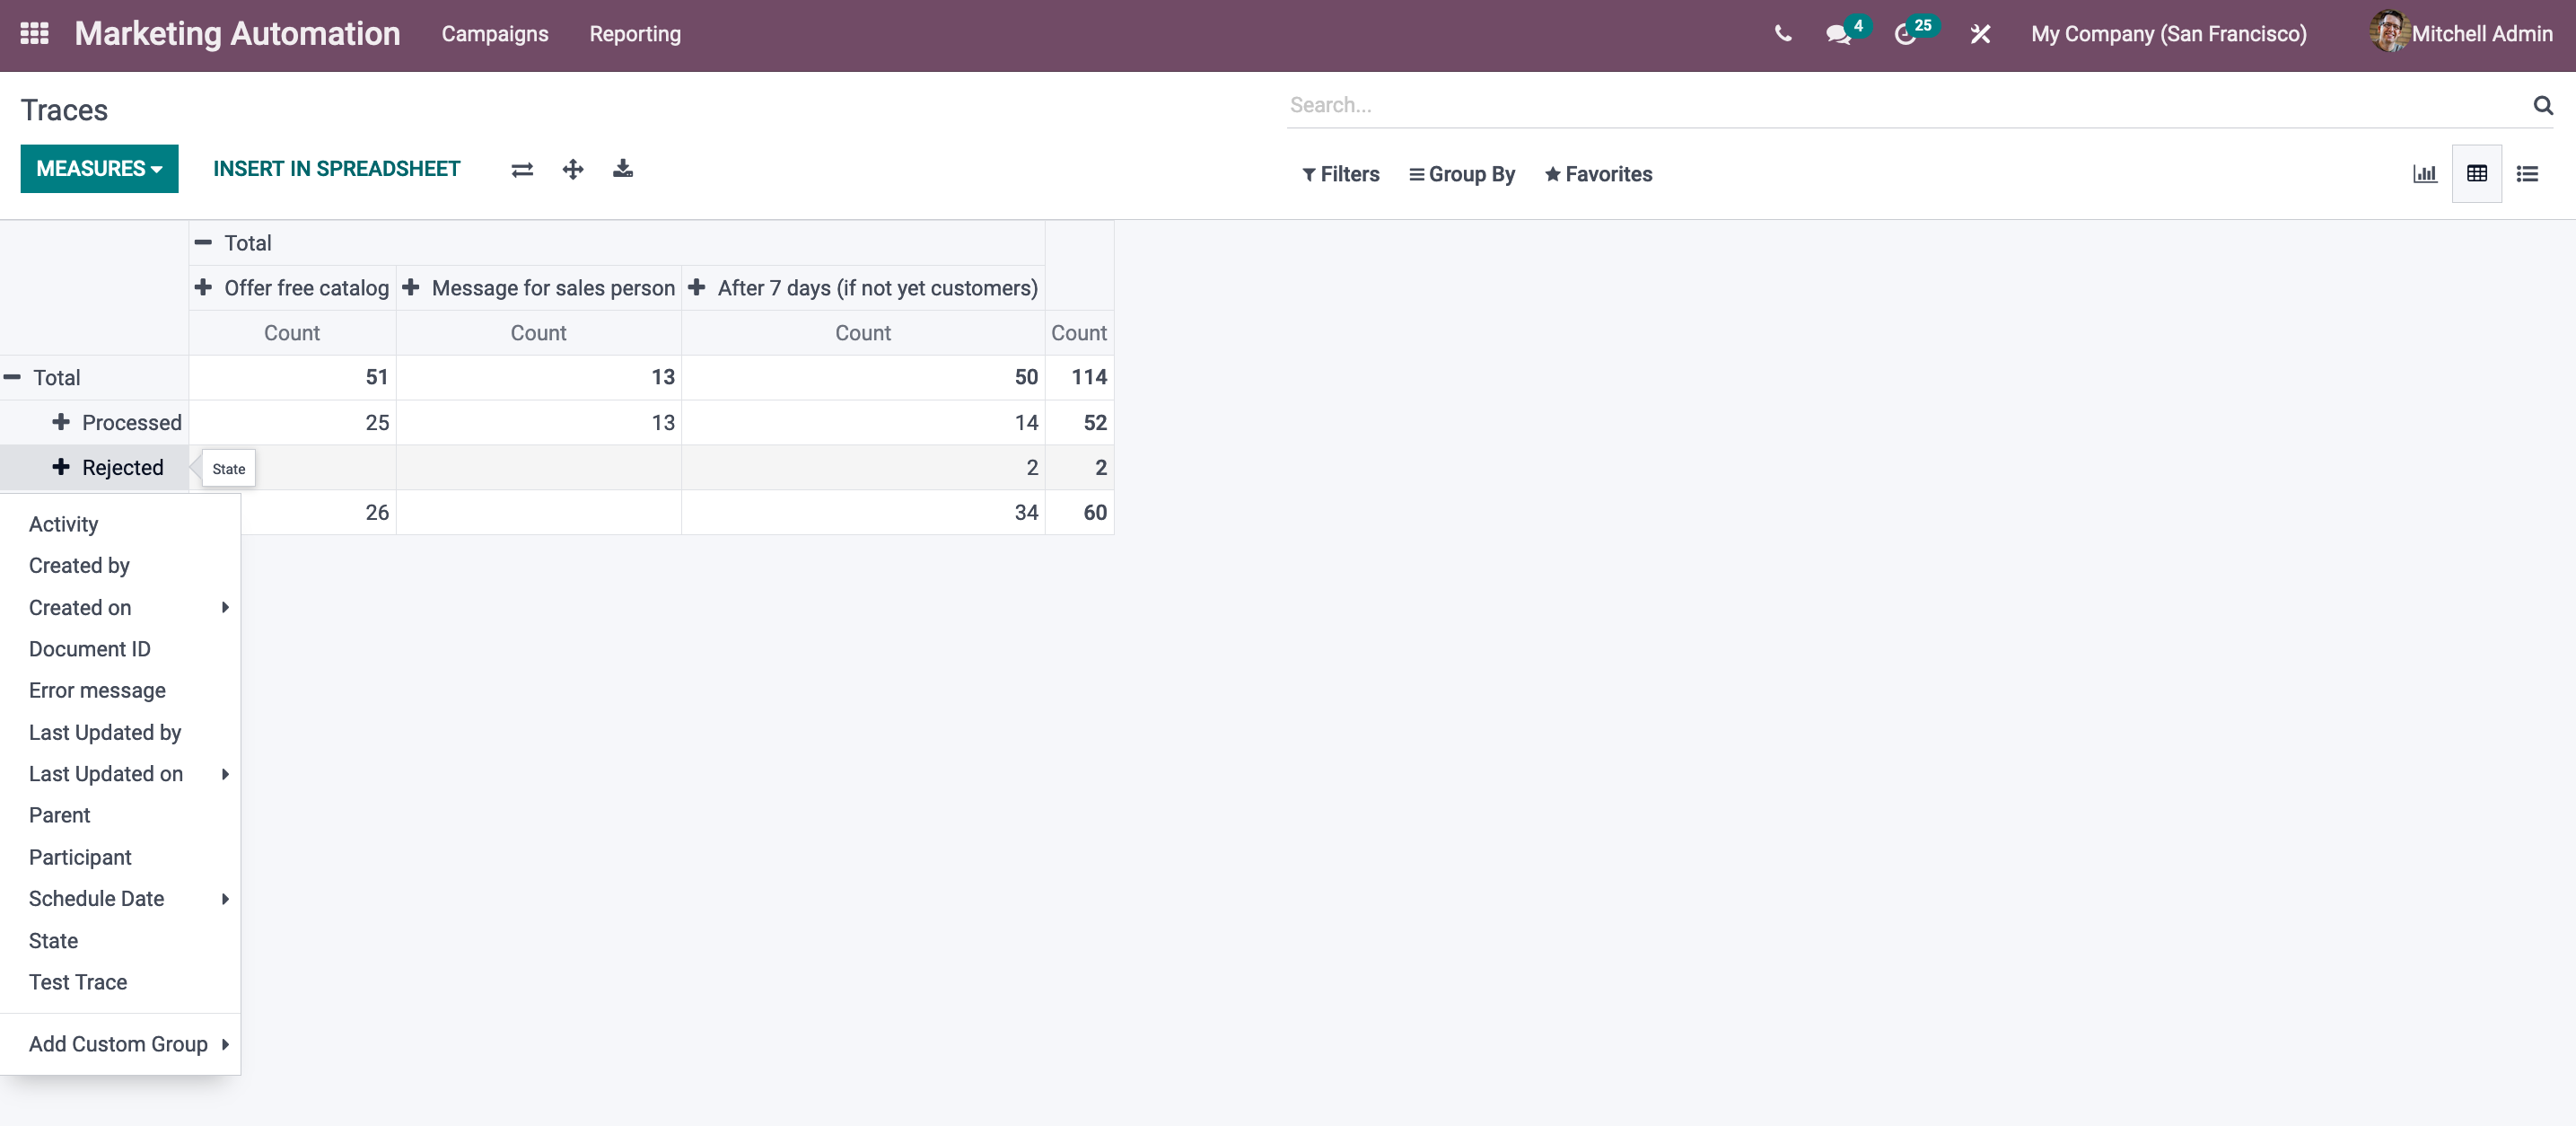
We may see the data in a tabular format in the Pivot view. The campaign, Created by, Created on, Last updated by, Last updated on, Model, Record ID, Record model, State, and Test record are some of the forms we can create reports in. You might be able to use the INSERT IN SPREADSHEET option to import the data into a spreadsheet.
On the upper left side of the window, you can also see options like Flip axis, Expand all, and download XLSX, MEASURES.

 
Now we may talk about the Participants window's graphical depiction. You can see the data in several graphical representations in the graph view, including a bar chart, a line chart, and a pie chart. You can create reports based on the Record ID and Count. This option is found under the MEASURES tab. 

The Model is displayed on the X-axis, and the Record ID is displayed on the Y-axis in the graph. The window's Pie chart view is displayed. 
 
Link Tracker is a tool that allows you to keep track

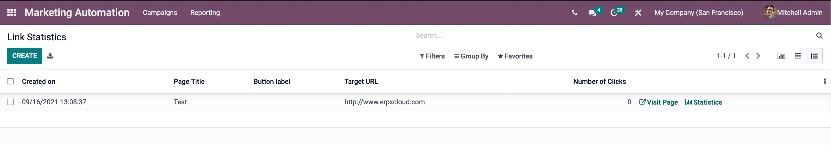
The Link Statistics window may be accessed via the Link Tracker menu, which can be found under the reporting tab of  Odoo Marketing Automation Module. The Link Statistics window in List view is depicted in the image above. You can see all of the Link statistics data in this box, including details like  Created on, Page Title, Button Label, Target URL, and Number of Clicks.

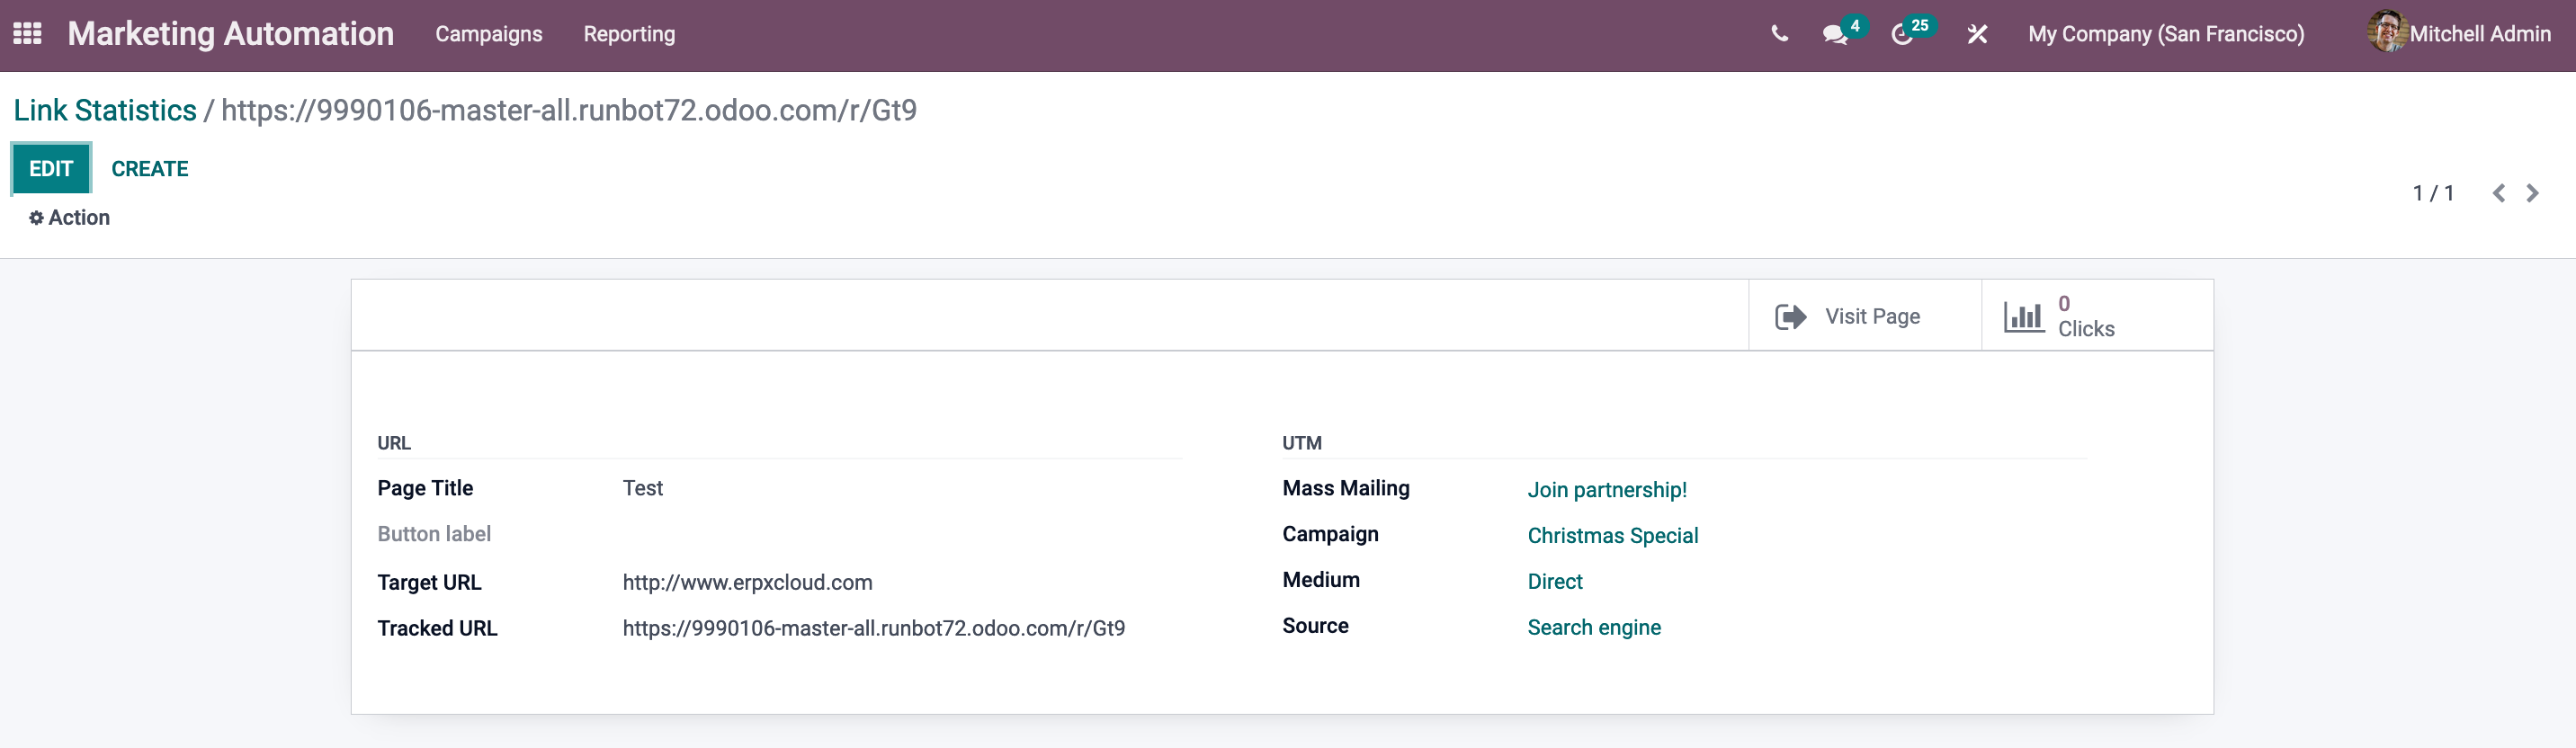
Each of the data can also be exported to an excel sheet. You can accomplish this by selecting the Export All option from the drop-down menu. Additionally, you can view each record individually by clicking on it. 

 
The image above shows the Link Statistics panel in List view. In this box, you can see all of the Link analytics data, including Created on, Page Title, Button Label, Target URL, and Number of Clicks. Each piece of information can be exported to an excel document. Select the Export All option from the drop-down menu to achieve this. Each record can also be viewed individually by clicking on it. 
 
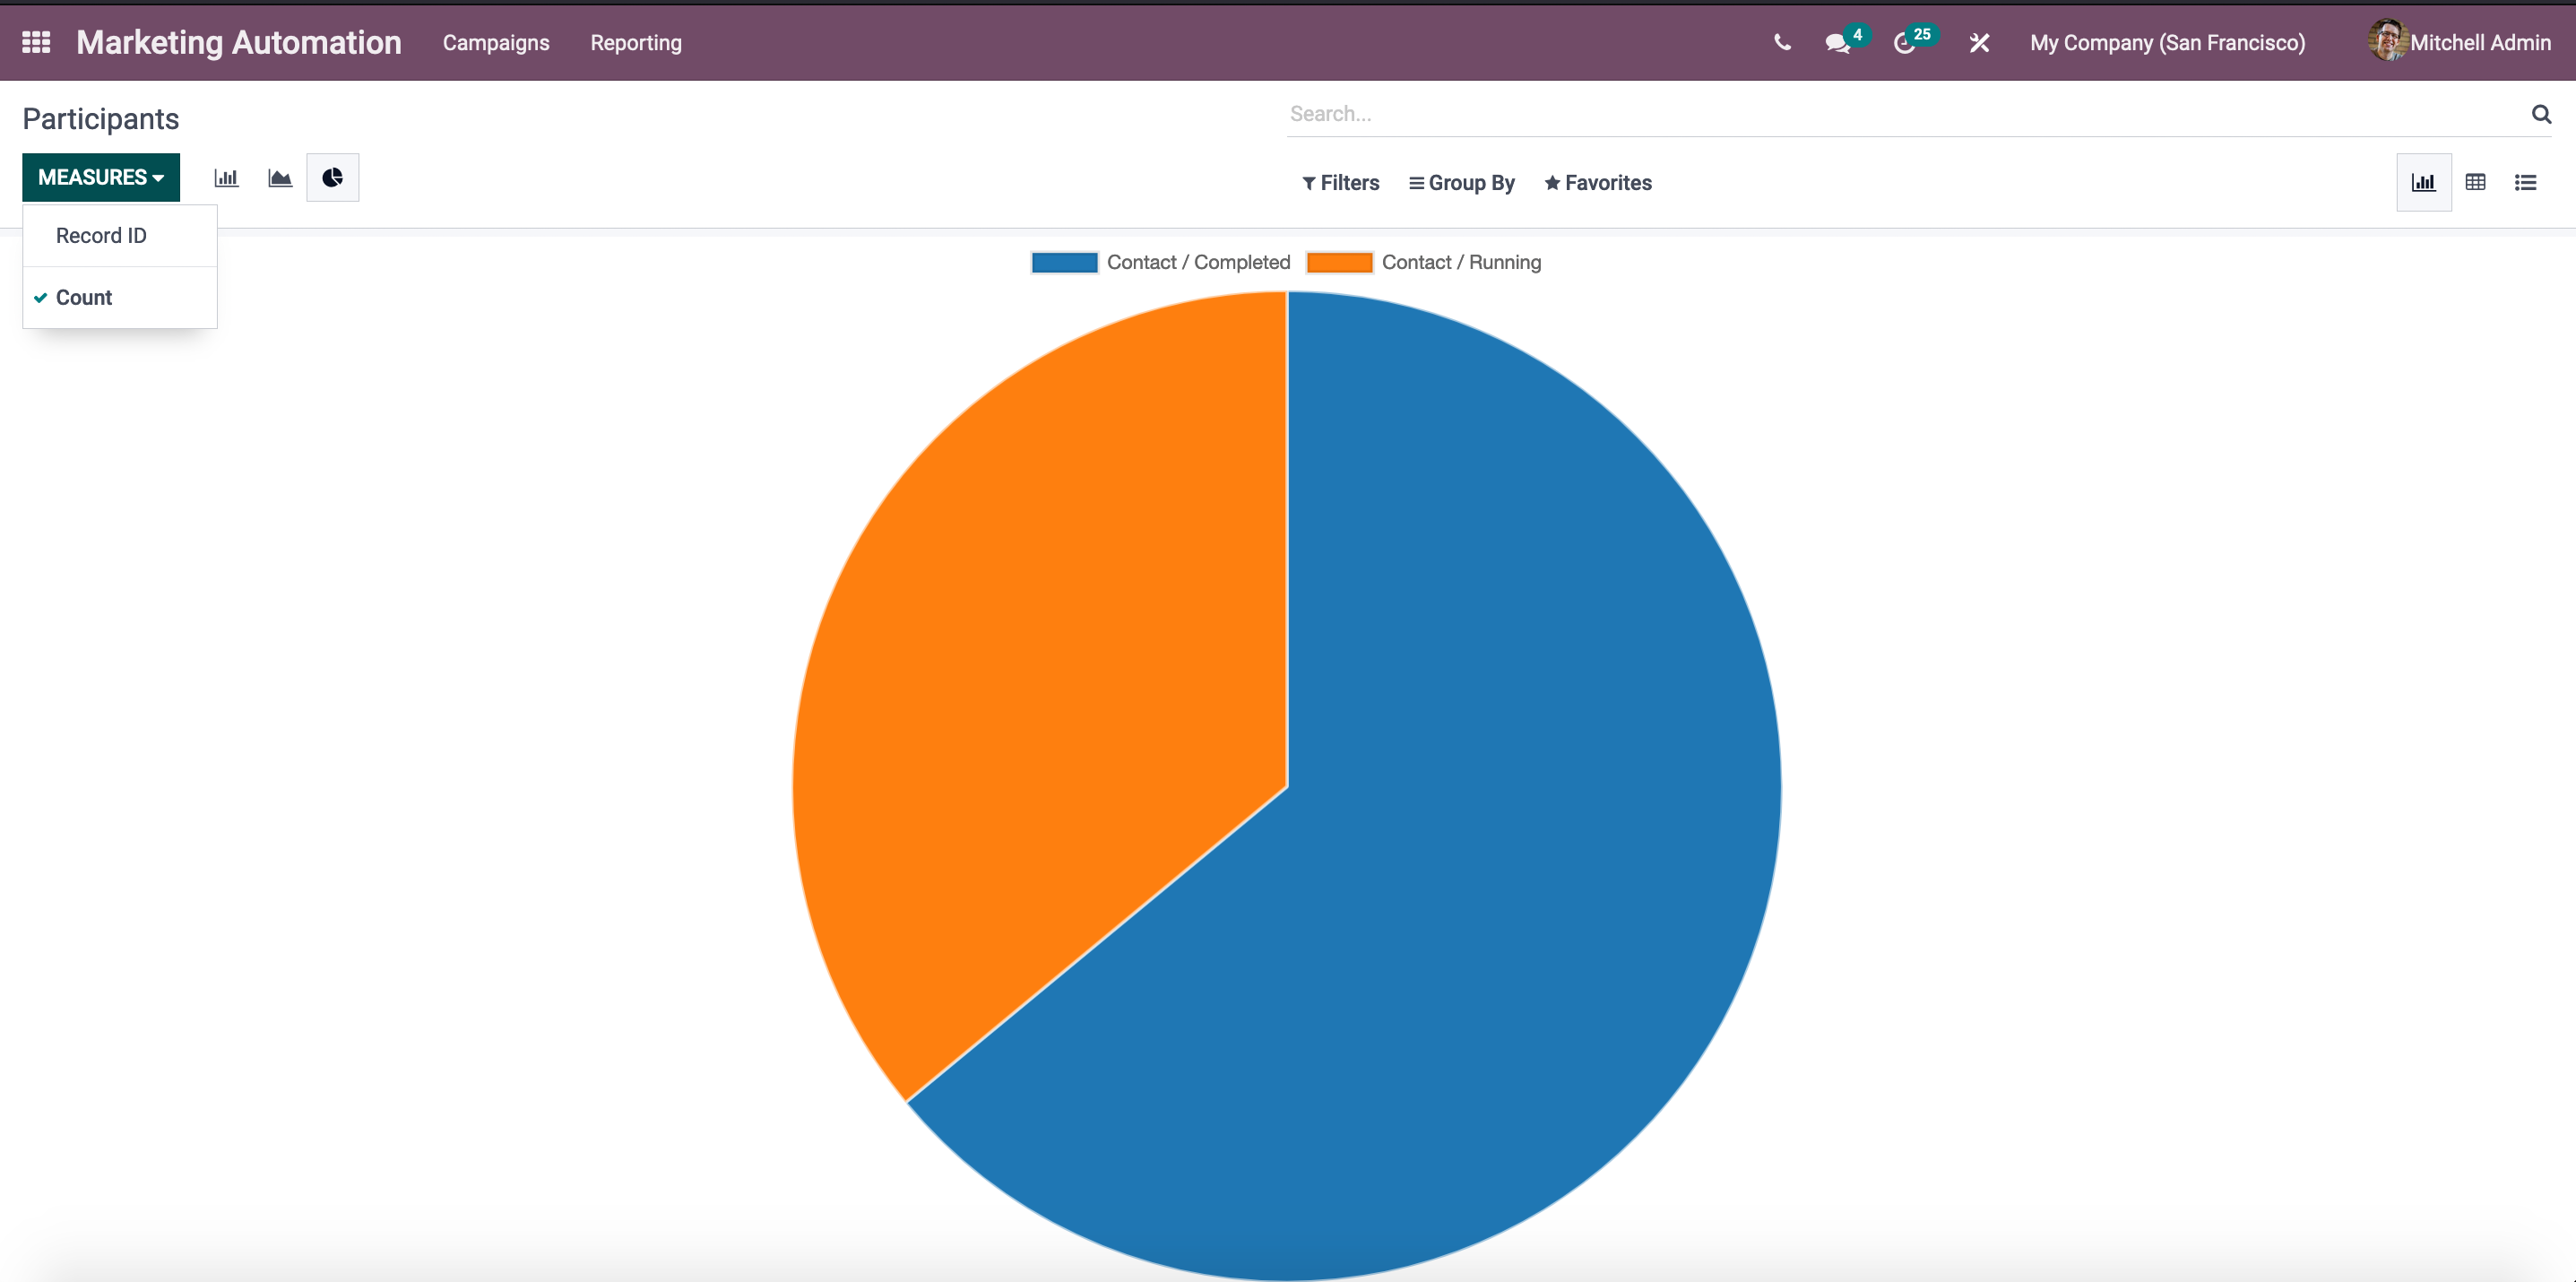
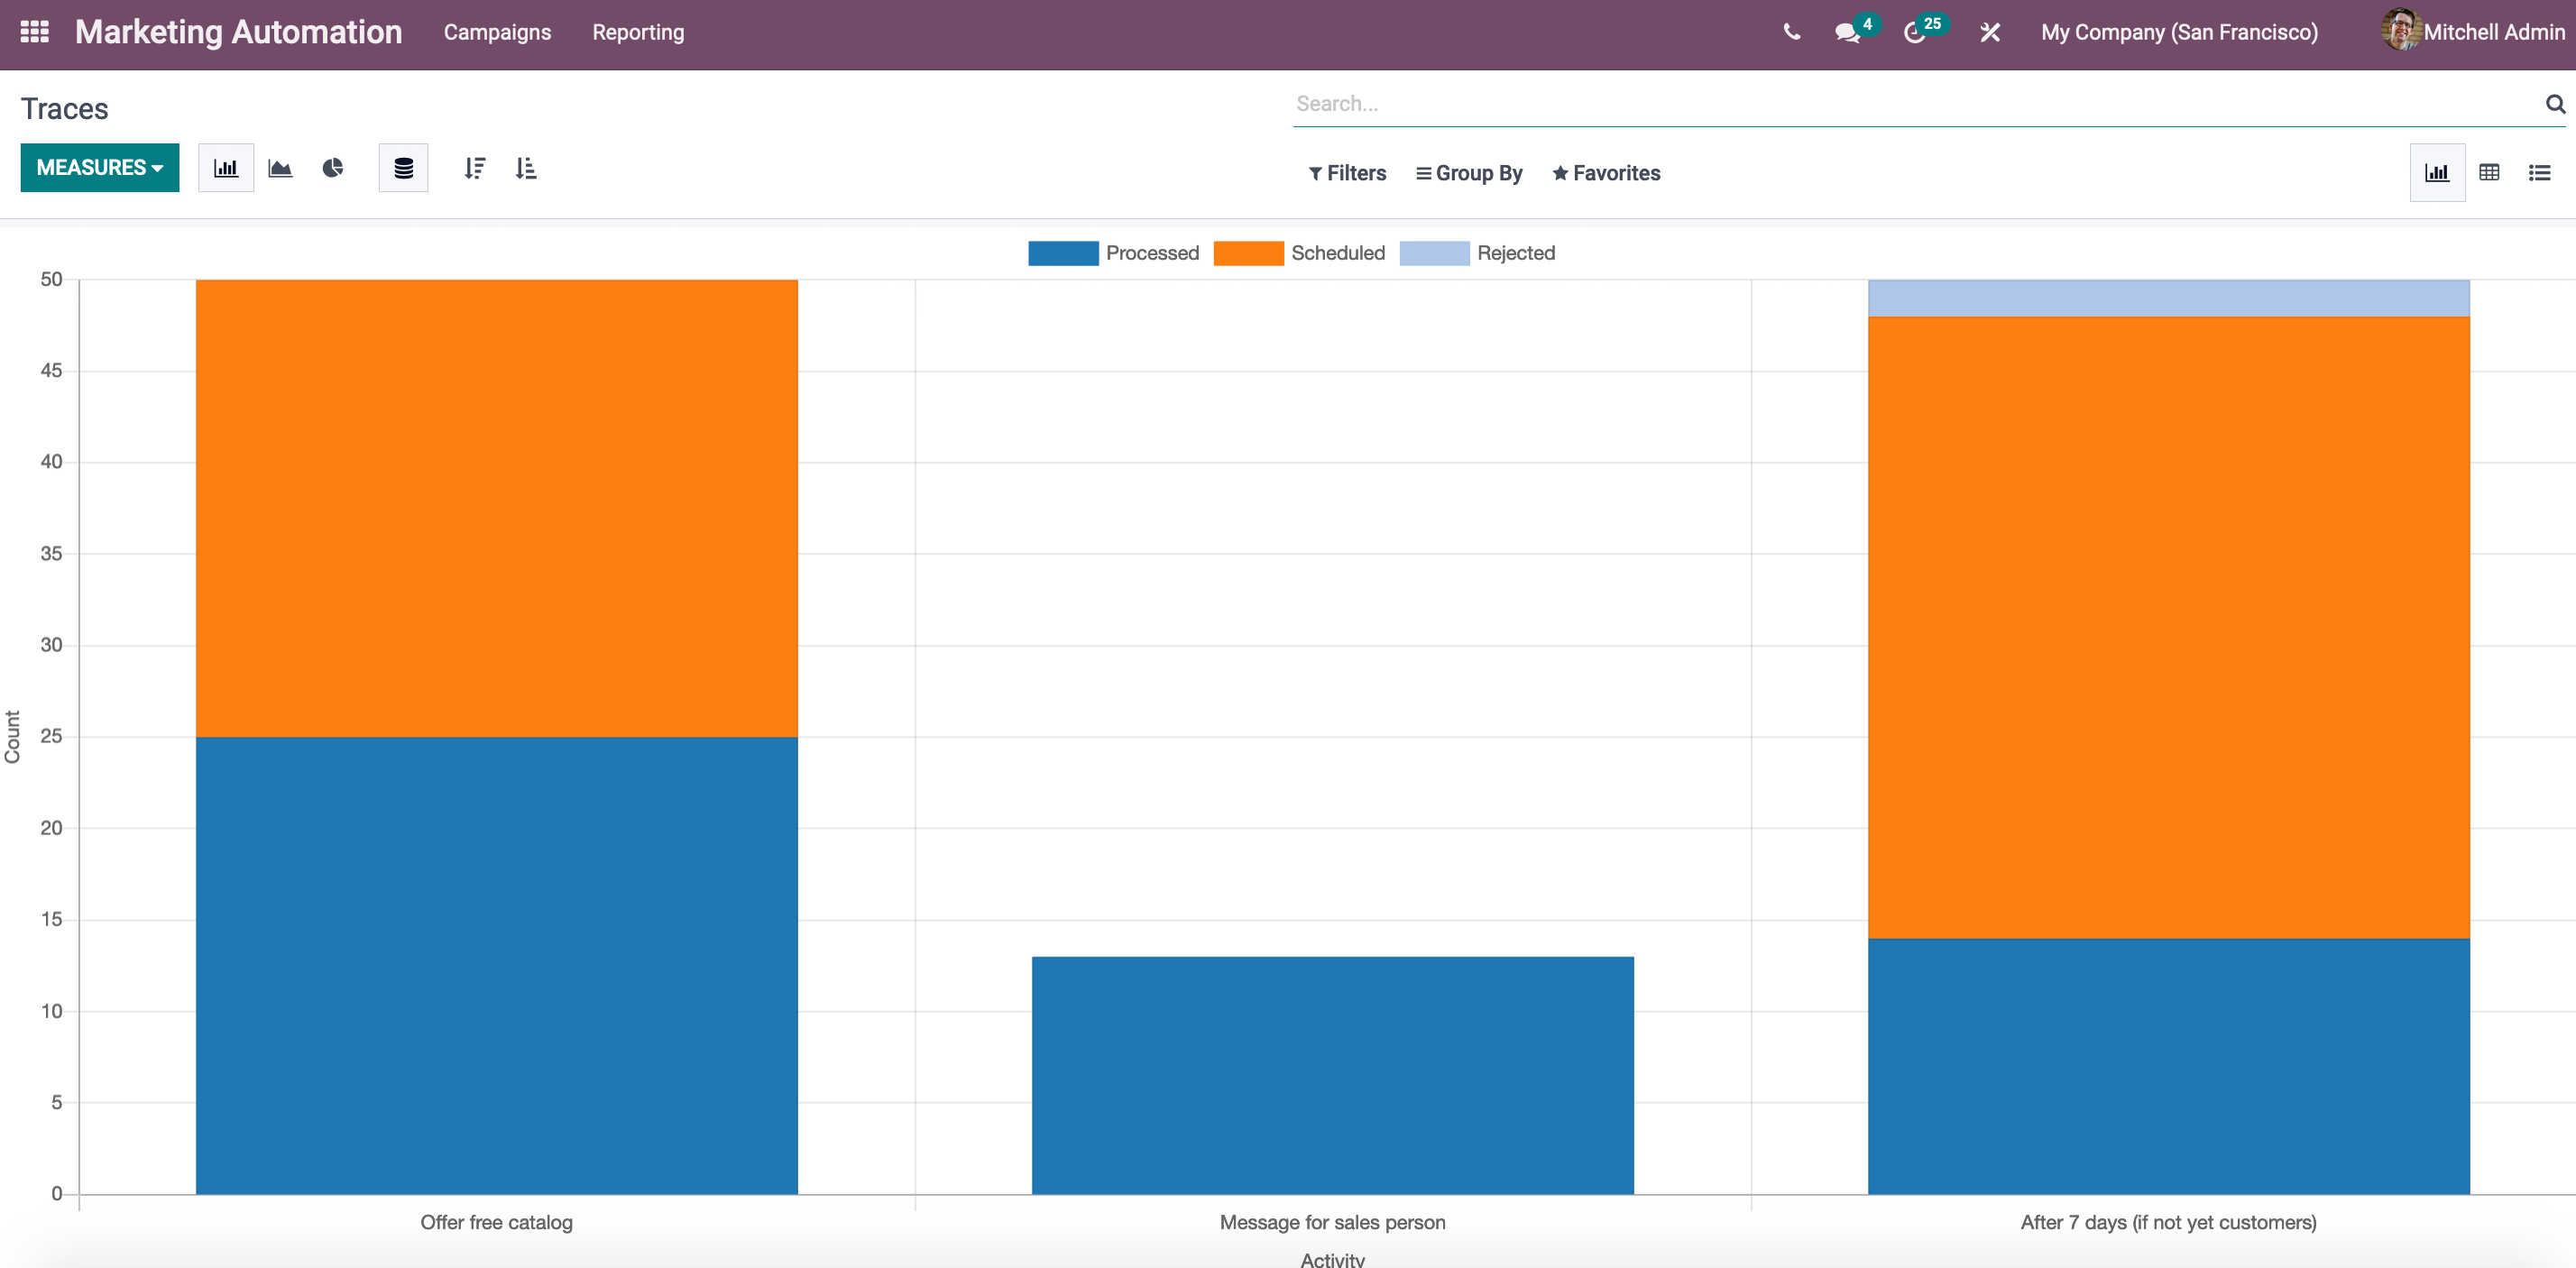
This is a Bar Chart, with the X-axis representing the Target URL and the Y-axis representing the Count. You can also generate reports based on the number of clicks made. You can represent this metric by selecting the option Number of Clicks from the MEASURES menu. You can also view data in a variety of ways, such as a bar chart, a line chart, or a pie chart. 

Traces

You may create and see numerous traces using the Traces option in the Reporting page of Odoo Marketing Automation Module. This window can be viewed in a variety of ways, including List, Pivot, and Graph views. Let's start with the List view choice.
You can view multiple Traces made on the platform in the Traces pane, along with details such as the Schedule date, Activity, Participants, and State. By selecting the CREATE option, you can create new Traces. Below is a screenshot of the creation window. 
 
You can assign an activity to a trace by using the dropdown menu in the Traces creation box. After that, you can use the calendar view to give the Schedule Date. The Participant's name, as well as the State, can be assigned. You can choose this from the dropdown menu, which includes options like Scheduled, Processed, Rejected, Cancelled, and Error. You can also look at the settings for Mass Mailing Statistics and Error Messages. You can save the details after providing the essential information by pressing the SAVE button. 
 
The Odoo Marketing Automation module Pivot view allows you to present data in a tabular format. As seen in the figure above, you can view the window in a variety of ways, including count, document ID, and both. 
The Odoo Marketing Automation module automates all of your marketing tasks while also assisting you in thoroughly assessing all of your workflows. You can also learn more about Odoo Marketing Automation by reading the blog below. 


Odoo 14 Marketing Automation Module
Ismail Harake September 16, 2021
Share this post
Our blogs
Sign in to leave a comment
Odoo Purchase Module Product Variants
  /